Hi! I am making a scatter plot from a DataFrame with hvplot. My data contain nans, and they show up in the plot as gray circles.
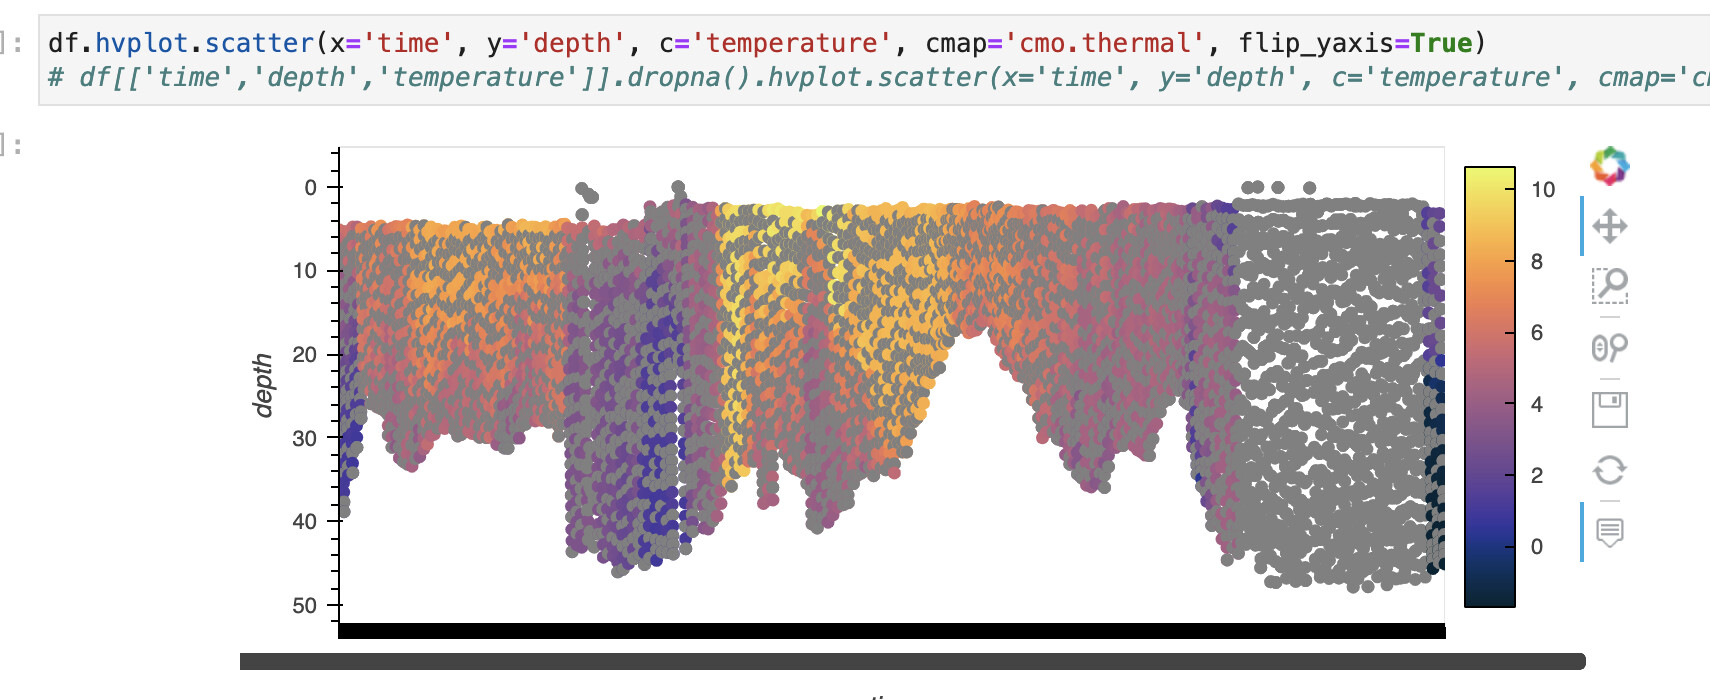
I would like to ignore the nan values instead of having them plot. Dropping them before the plot fixes the problem, but it is not an option because I am writing a plot command for an intake catalog entry. I’m hoping for a flag like
ignore_nans=True to be able to input in the plot call. Thanks for any help!