Implement a colored frame around graph tiles (panel bokeh)

Hello everyone,

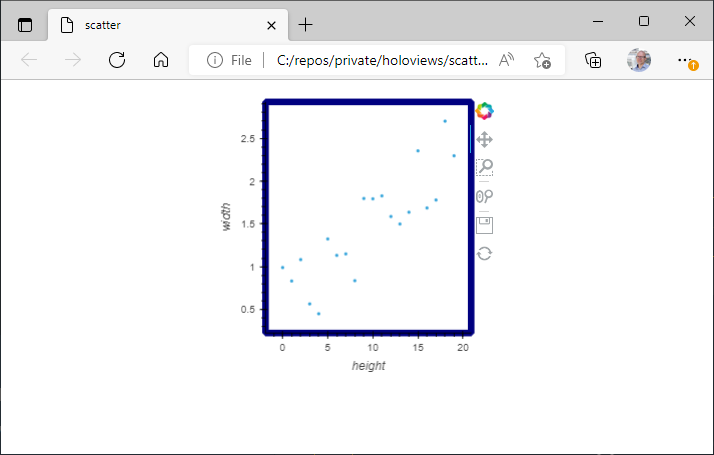
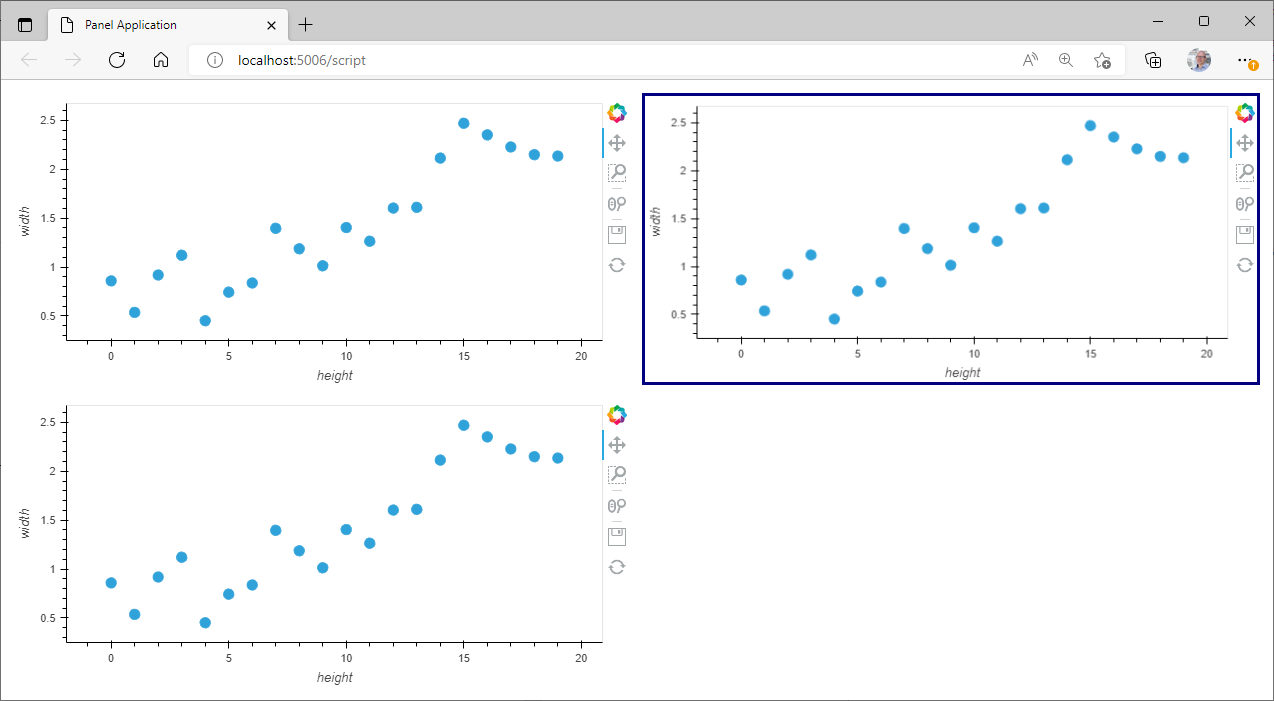
How can I let bokeh draw a border (frame) around the graph tile? Some graph tiles have to be graphically highlighted against the other graphs and the costumer wants to have a colored border/colored frame around some graph tiles. I did not find anything to it in the documentation on Holoviz bokeh.
Is it even possible?

Thanks in advance.
Best regards

no one an idea? Should I clarify my question more?

Please provide more information. Is this for a Bokeh plots created with HoloViews, that are served in a Panel app?

Hi @SP404_MPC1000

If you want to use HoloViews alone, you might be able to bokeh hooks

import numpy as np

import holoviews as hv
from bokeh.themes.theme import Theme

hv.extension("bokeh")

def hook(plot, element):
    plot.state.outline_line_width = 7
    plot.state.outline_line_color="navy"
    print("hook")

data = dict(
    height=[value for value in range(0,20)],
    width=[value/10+np.random.random() for value in range(0,20)]
)
scatter = hv.Scatter(data, kdims="height", vdims="width")
scatter.opts(hooks=[hook])
hv.save(scatter, "scatter.html")

See

https://holoviews.org/user_guide/Customizing_Plots.html#plot-hooks

Hi @SP404_MPC1000

If you want to combine with Panel you can use css

import numpy as np
import panel as pn

import holoviews as hv
pn.config.raw_css=[]
pn.config.raw_css.append("""
.bk-root .bk.highlight canvas.bk{
    border: 3px solid navy;
}
""")
pn.extension(sizing_mode="stretch_both")
hv.extension("bokeh")

data = dict(
    height=[value for value in range(0,20)],
    width=[value/10+np.random.random() for value in range(0,20)]
)
scatter = hv.Scatter(data, kdims="height", vdims="width").opts(size=10)
scatter2 = scatter.clone()
scatter3 = scatter.clone()

plots = pn.GridBox(
    scatter,
    pn.Row(scatter2, css_classes=["highlight"]),
    scatter3, ncols=2
).servable()