In like to use Panel in my primary software for the interactivity, but I usually develop this using Jupyter Notebooks. The Notebooks also serve as good documentation. Anyway, when I use widgets everything works out well, but with Panel I get a double plot because I need to return my fig for an interactive plot. I want to keep it all in the Notebook with no panel servers. Is there a way that I could still use Panel in my Notebook so I do not need to rewrite each interactive plot?
Hi @Philliec459,
Could you provide an example of your issue? I’m not sure I understand what you mean by “double plot” or “rewrite each interactive plot”. Thanks!
‘’’
This is the ipywidgets version
‘’’
CBW_Int_slider = widgets.FloatSlider(min=0,max=0.5,step=0.01,value=0.25,description=‘CBW_Intercept’)
widgets.interact(cbw_int_plot, CBW_Int = CBW_Int_slider)
‘’’
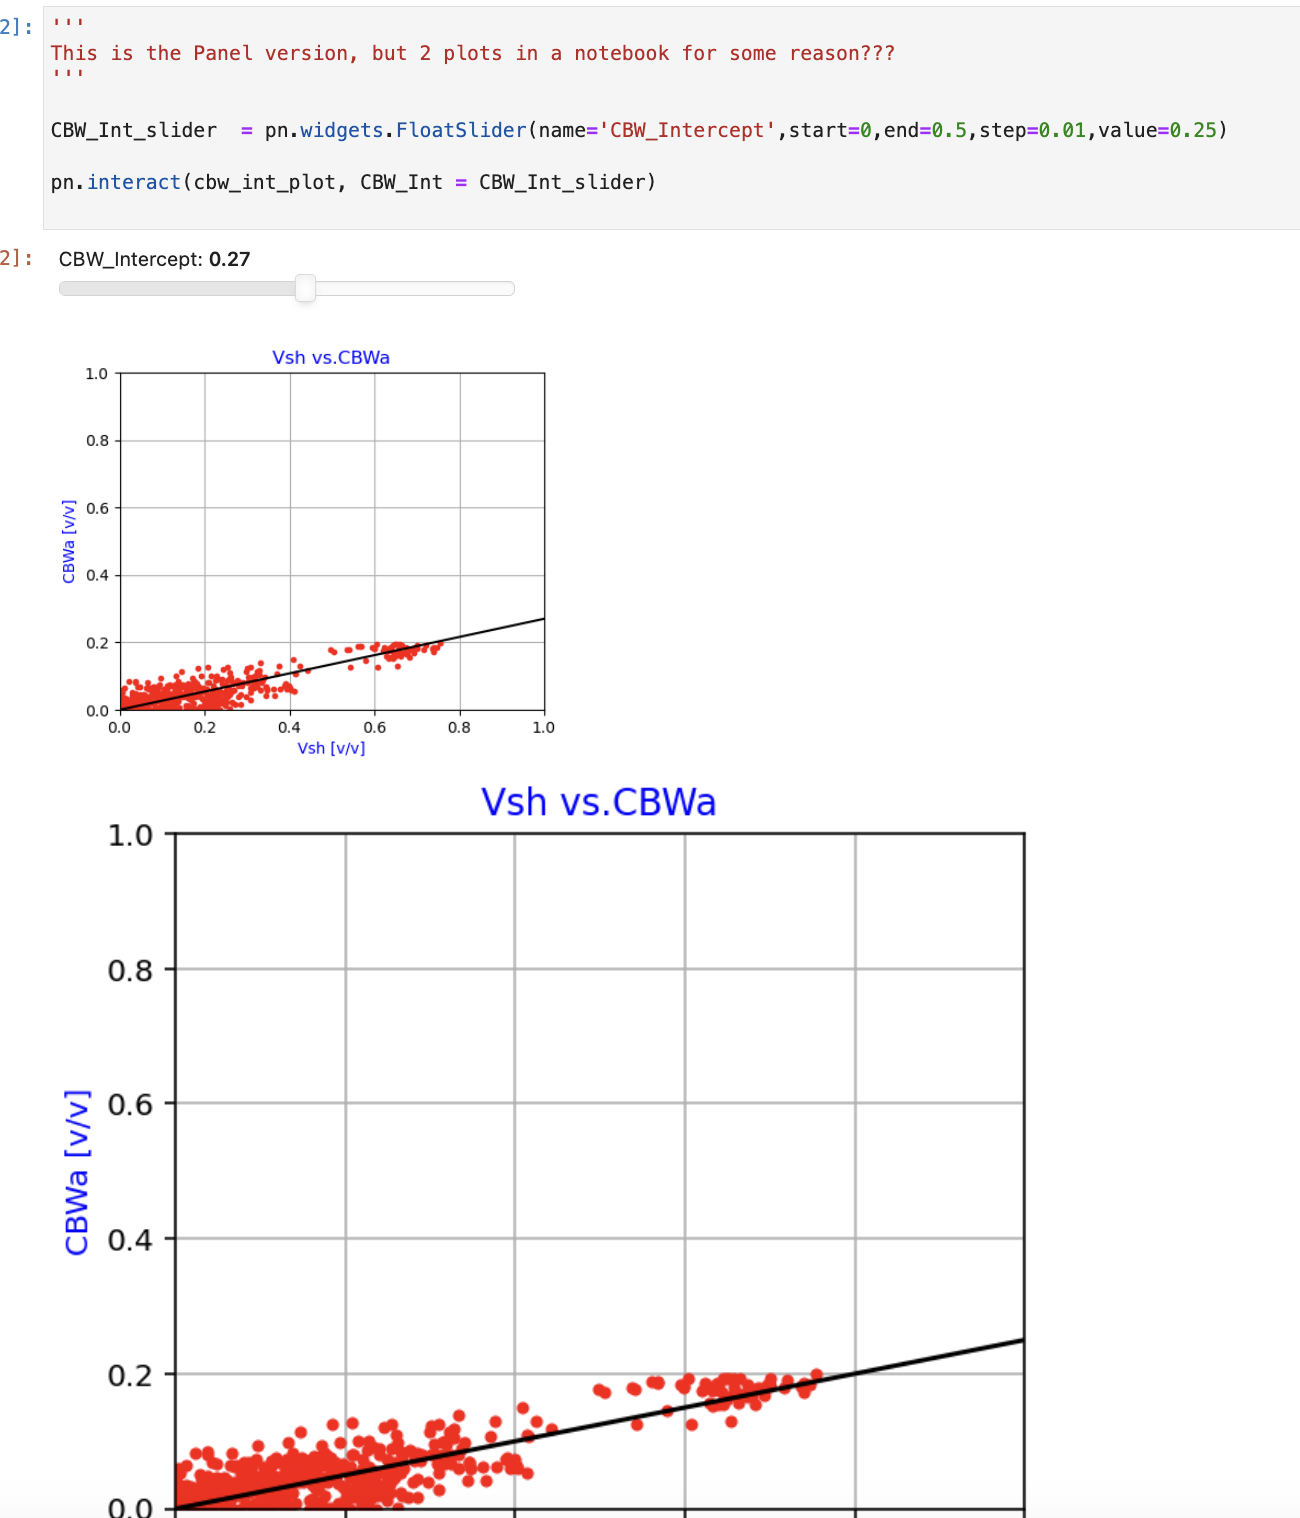
This is the Panel version, but 2 plots in a notebook for some reason???
‘’’
CBW_Int_slider = pn.widgets.FloatSlider(name=‘CBW_Intercept’,start=0,end=0.5,step=0.01,value=0.25)
pn.interact(cbw_int_plot, CBW_Int = CBW_Int_slider)
This is the cross plot definition:
def cbw_int_plot(CBW_Int):
fig=plt.figure(figsize=(5,4))
plt.title(‘Vsh vs.CBWa’, color = ‘blue’)
#if Sw_quick(m_cem,n_sat,Rw) > 0.8:
plt.plot(logs.vsh,logs.CBWa,‘r.’, label=‘’,color=‘red’)
#plt.plot(logs.vsh,logs.vsh*CBW_Int,‘k-’, label=‘’,color=‘black’)
plt.plot(np.arange(10), np.arange(10) * CBW_Int, “k-”, label=“”)
plt.xlim(0.0,1)
plt.ylim(0.0,1.0)
plt.ylabel(‘CBWa [v/v]’, color = ‘blue’)
plt.xlabel(‘Vsh [v/v]’, color = ‘blue’)
#plt.grid(True, which=‘both’,ls=‘-’,color=‘gray’)
plt.grid()
#return fig
The widgets version works good with interactivity, but the panel version plots but with no interactivity. If I use return fig at the end of the plot definition, then both methods plot a second plot below the first plot. For widgets both plots are interactive. For Panel on the top plot of the two plots are interactive.
Is plt.switch_backend sufficient for your needs?
import matplotlib.pyplot as plt
import numpy as np
import panel as pn

plt.switch_backend("agg")
pn.extension()


def cbw_int_plot(CBW_Int):
    fig = plt.figure(figsize=(5, 4))
    plt.title("Vsh vs.CBWa", color="blue")
    plt.plot(np.arange(10), np.arange(10) * CBW_Int, "k-", label="")
    plt.xlim(0.0, 1)
    plt.ylim(0.0, 1.0)
    plt.ylabel("CBWa [v/v]", color="blue")
    plt.xlabel("Vsh [v/v]", color="blue")
    plt.grid()
    return fig


CBW_Int_slider = pn.widgets.FloatSlider(
    name="CBW_Intercept", start=0, end=0.5, step=0.01, value=0.25
)
pn.interact(cbw_int_plot, CBW_Int=CBW_Int_slider)
Thank you. That was a perfect solution. Now I can program in Pane for my documented notebooks and then use the same code in my primary application. Great solution. Thank you for providing such a simple solution.
1 Like
I have this same code as shown above, but now in another program. To see the interactive widgets for this program I think I need to use panel server:
CBW_Int_slider = pn.widgets.FloatSlider(name=‘CBW_Intercept’,start=0,end=0.5,step=0.01,value=cbw_int)
pane = pn.interact(cbw_int_plot, cbw_int = CBW_Int_slider)

def button_callback():
    sys.exit()  # Stop the server

# Button to stop the server
button = Button(label="Stop", button_type="success")
button.on_click(button_callback)

def app():

    return pn.Row(pn.Column( button, pane[0],width=350,height=350, sizing_mode="fixed"), pn.layout.VSpacer(width=10),pane[1])

pn.serve({"localhost:": app}, port=5006)
I can’t seem to retrieve the CBW_Int_slider.value
cbw_int = CBW_Int_slider.value
to run the remaining parts of my script.
It could be that my stop button closes the program before it gets a chance to do this??? I need to retrieve this CBW_Int_slider.value.
I have a piece of code that sort of works. My goal is to some how save the constant CBW_Int that I pick from the panel server. I cannot seem to pass this on automatically so that I could then use this constant after the interactive widget work. Is there a way to do this:
import panel as pn
import matplotlib.pyplot as plt
import numpy as np
from bokeh.models.widgets import Button
CBW_Int = 0.25 # Define CBW_Int as a global variable
CBW_Int_slider = pn.widgets.FloatSlider(name=‘CBW_Intercept’, start=0, end=0.5, step=0.01, value=CBW_Int)
def cbw_int_plot(plot=True):
global CBW_Int # Access the global CBW_Int variable
fig = plt.figure(figsize=(6, 6))
plt.title('Vsh vs.CBWa', color='blue')
plt.plot(np.arange(10), np.arange(10) * CBW_Int, "k-", label="")
plt.xlim(0.0, 1)
plt.ylim(0.0, 1.0)
plt.ylabel('CBWa [v/v]', color='blue')
plt.xlabel('Vsh [v/v]', color='blue')
plt.grid()

if plot:
    plt.show()
else:
    plt.close(fig)

return fig
def button_callback(event):
global CBW_Int
CBW_Int = CBW_Int_slider.value

# Save the new CBW_Int value to a file
with open("new_cbw_int.txt", "w") as f:
    f.write(str(CBW_Int))

#pn.io.server_stop()
pn.io.serve(pn).stop()
button = Button(label=“Stop”, button_type=“success”)
button.on_click(button_callback)
def plot_update():
fig = cbw_int_plot(plot=False)
return pn.pane.Matplotlib(fig)
def app():
return pn.Column(
button,
pn.Row(CBW_Int_slider),
plot_update,
)
pn.serve({“localhost:”: app}, port=5006)