I am playing around with hvplot for xarray data sets, and noticed that there are some errors when trying to use time as one of the plotting axis. Here is some example code:
import xarray as xr
import hvplot.xarray # noqa
air_ds = xr.tutorial.open_dataset('air_temperature').load()
air = air_ds.air
air_ds.air.sel(time='2013-01-01T00:00:00', method='nearest').hvplot() # works
air_ds.air.sel(lon=200.0, method='nearest').plot() # works
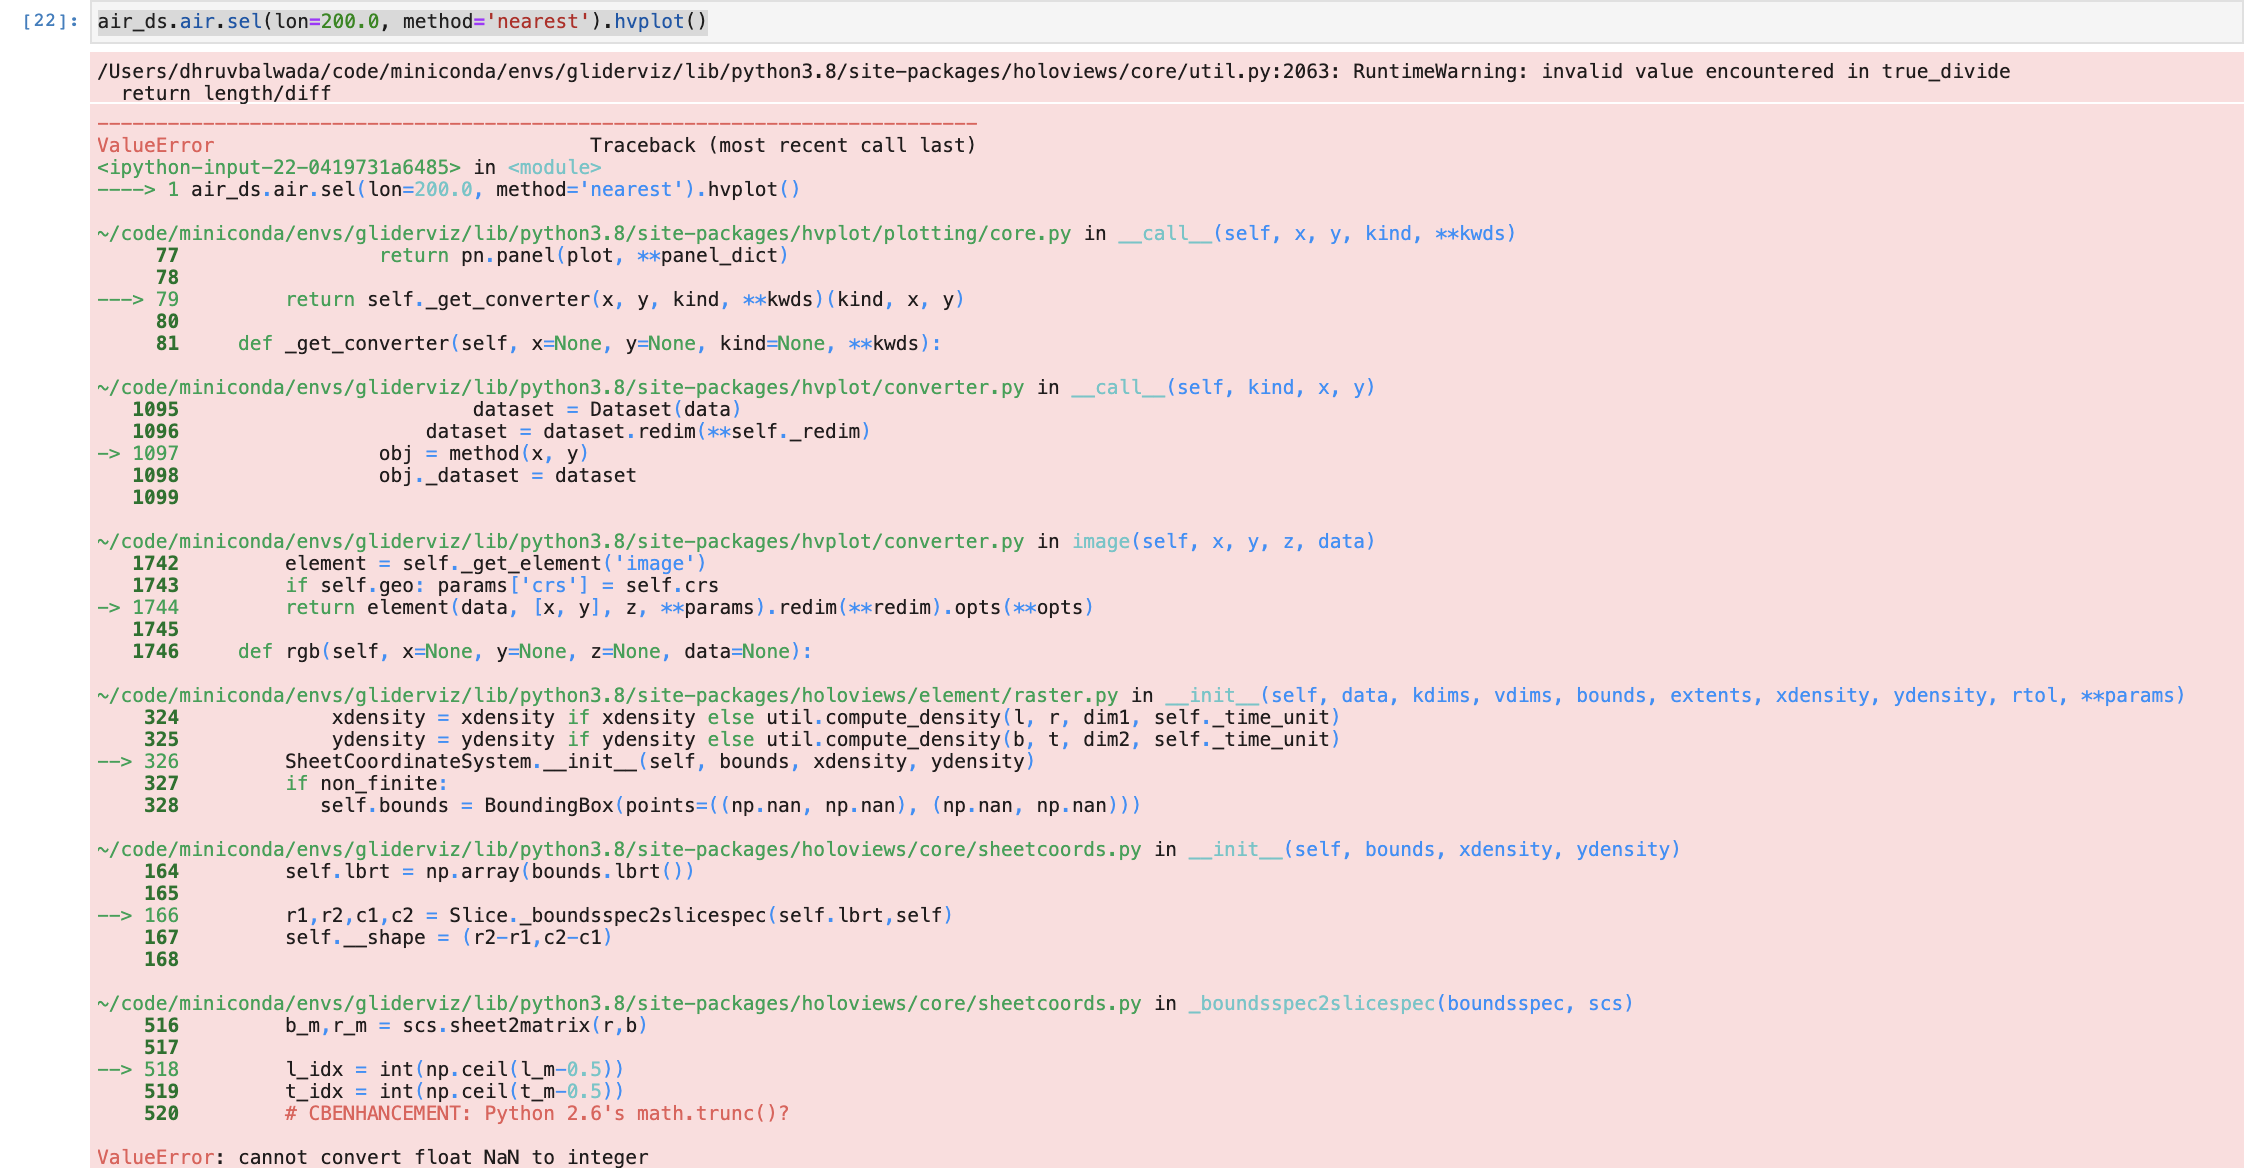
air_ds.air.sel(lon=200.0, method='nearest').hvplot() # does not work
Here is the error: