Hi, I’m wondering if it’s possible to define a function that creates a multidimensional DyamicMap that does not contain any data? When defining a function, I’ve noticed that I would have to pass some data argument into hv.Curve in order to specify kdims.
The idea here is to initialize empty DynamicMap canvas(es) that are empty to begin with, but will read data from a streamz dataframe and then graph a multidimensional DynamicMap. Hopefully this multidimensional DynamicMap can be cycled through via a drop-down widget.
Great question. Could you provide a small code example that illustrates what you would like to do?
It would make it easier to understand the problem, faster to create a (code) solution and help create a code base for the community. And if possible include some kind of screen shot.
(I don’t know the answer. But if I had a small code example I would like to try to find a solution)
import panel as pn
import holoviews as hv
import streamz
import streamz.dataframe
import numpy as np
import pandas as pd
from holoviews import opts
from holoviews.streams import Buffer
from functools import reduce

hv.extension('bokeh')

# This dictionary defines what is being plotted.
data_dict = {'multilabel': ['hamming_score', 'hamming_loss'], 'regression': ['mean_square_error', 'mean_absolute_error']}

metric_list = ['samples']
dmap_layout_dict = dict.fromkeys(data_dict.keys(), [])

# Concatenate the statistic and score into a list of single strings
for stat, score_id in data_dict.items():
    for score in score_id:
        metric_list.append("_".join([stat, score]))

# Create a streaming dataframe with columns from the metric list
df_metrics = pd.DataFrame(index=[], columns=metric_list).set_index('samples')
df_metric_stream = streamz.dataframe.DataFrame(streamz.Stream(), example=df_metrics)

metric_dict = dict.fromkeys(metric_list[1:])
score_set = set(sum(data_dict.values(), []))

# Create a single dynamic map for each columns in the streaming dataframe.
for metric_id in metric_dict:
    metric_dict[metric_id] = hv.DynamicMap(hv.Curve, streams=[Buffer(df_metric_stream[metric_id])])
    for score in score_set:
        if score in metric_id:
            metric_dict[metric_id] = metric_dict[metric_id].relabel(score)
            break

# Create an overlay of scores belonging to multi-label classification and regression.
for stat in data_dict.keys():
    stat_group = dict(filter(lambda item: stat in item[0], metric_dict.items()))
    if len(stat_group) > 1:
        overlayed_dmap = reduce((lambda x, y: x * y), list(stat_group.values()))
        overlayed_dmap.opts(opts.Curve(width=600, show_grid=True, tools=['hover'])).opts(legend_position='right', xlabel='Index', ylabel='Value')
        dmap_layout_dict[stat] = overlayed_dmap
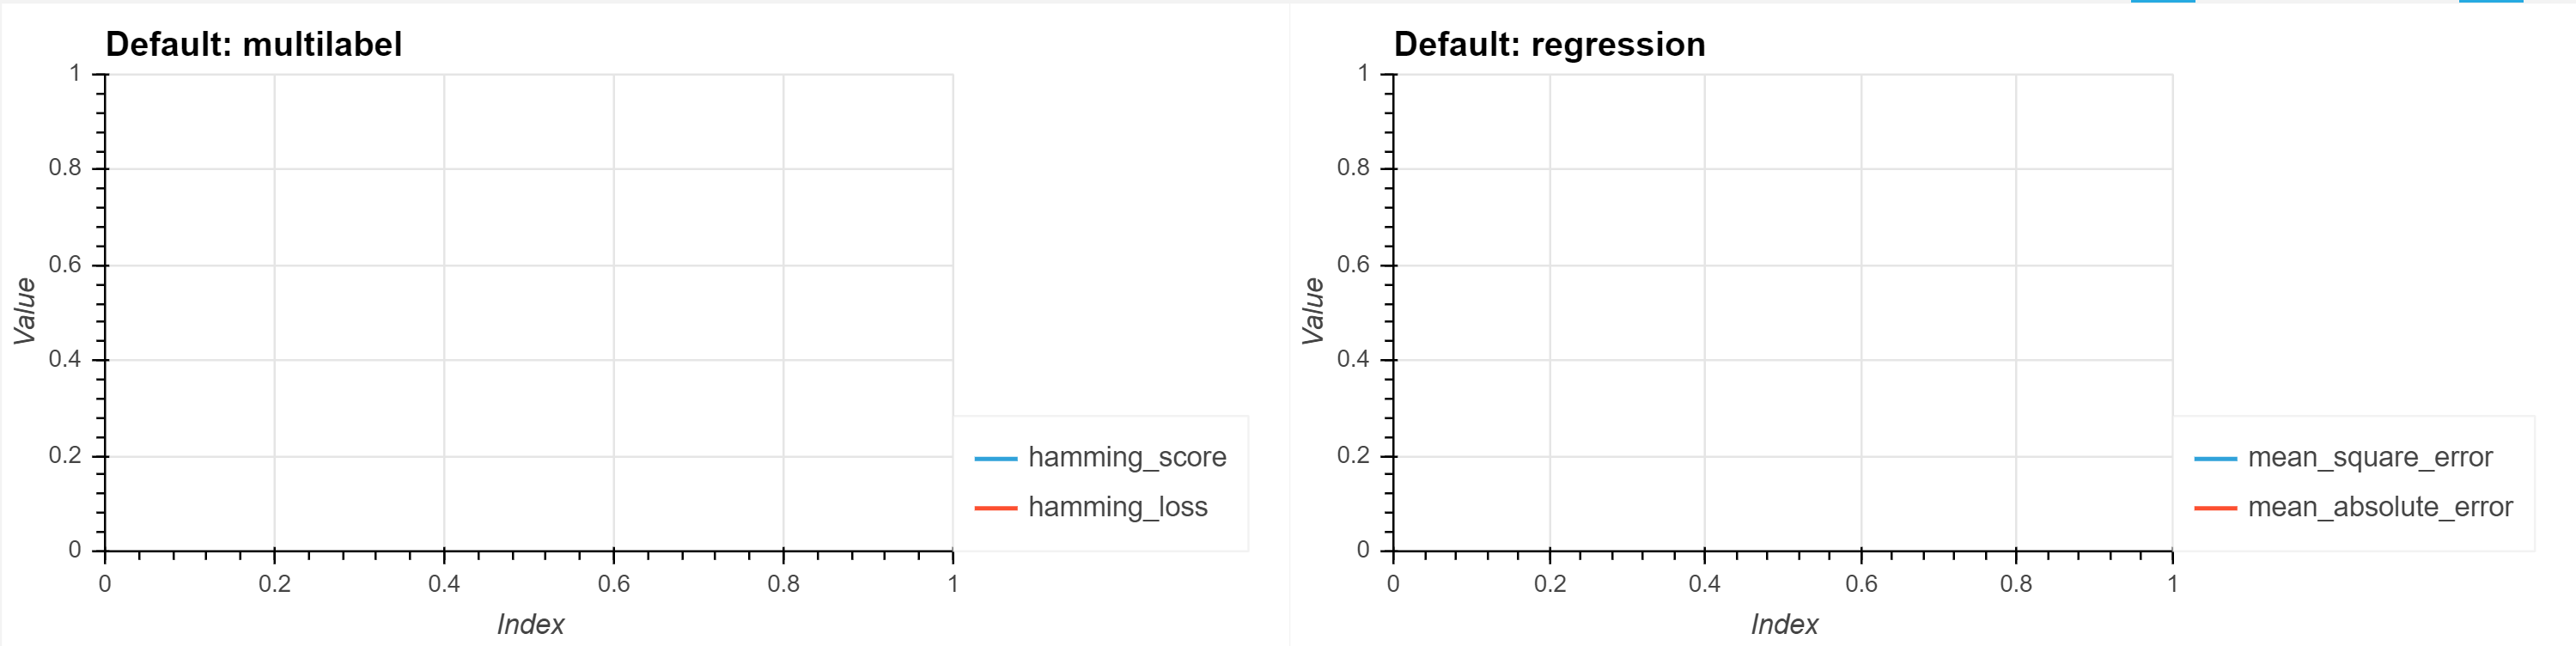
The example initializes four empty DynamicMap canvases in total and is ready to receive streaming data. However, it feels very hard-coded and I haven’t found an easy way to make a multidimensional DynamicMap where I can switch between multi-label classification and regression via a drop-down box. Certainly, there must be a way to initialize multidimensional empty canvases with a function?