Hi all,
I’m trying to apply .interactive() and hvplot.bind() to an xarray, basically just multiplying the array with a pn.widgets.IntSlider-controlled multiplier and having the resulting Dataset visualised as an image each time the widget is changed.
I don’t think I get the syntax right though, since the hover-over values and legend do not change when I change the slider.
Running this in a ipynb in VSCode v1.68.0
hvPlot 0.8.0
panel 0.13.1
import rioxarray
import hvplot.xarray
import panel as pn

array = rioxarray.open_rasterio(r'....tif') # GeoTIFF

multiplier = pn.widgets.IntSlider(start=0, end=10, step=1, value=5, name='Multiplier')

def func(array, multiplier): # Can the bound function have more than one argument?

    output_array = array * multiplier
    output_ds = output_array.to_dataset(dim=None, name='name')
    return output_ds

xri = hvplot.bind(func, array, multiplier).interactive()

# For some reason, I have to use the below syntax here to get the graph to display
# using xri.hvplot(groupby='band', ...' directly here does not diplay anything

interactive = (
    xri.hvplot(groupby='band', frame_width=600, data_aspect=1)
)

pn.Column(
    interactive.widgets(),
    interactive.panel(),
).servable()
The array’s repr below:
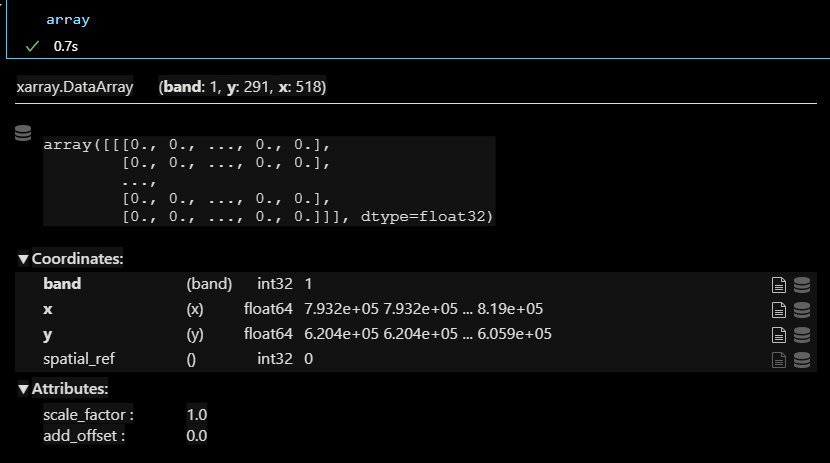
Any advice on what I’m not getting? Thanks a mil!