Hi, I am quite amazed about the variety and the visibility of the plots generated by this library.
I hope my message explains well about the situation.
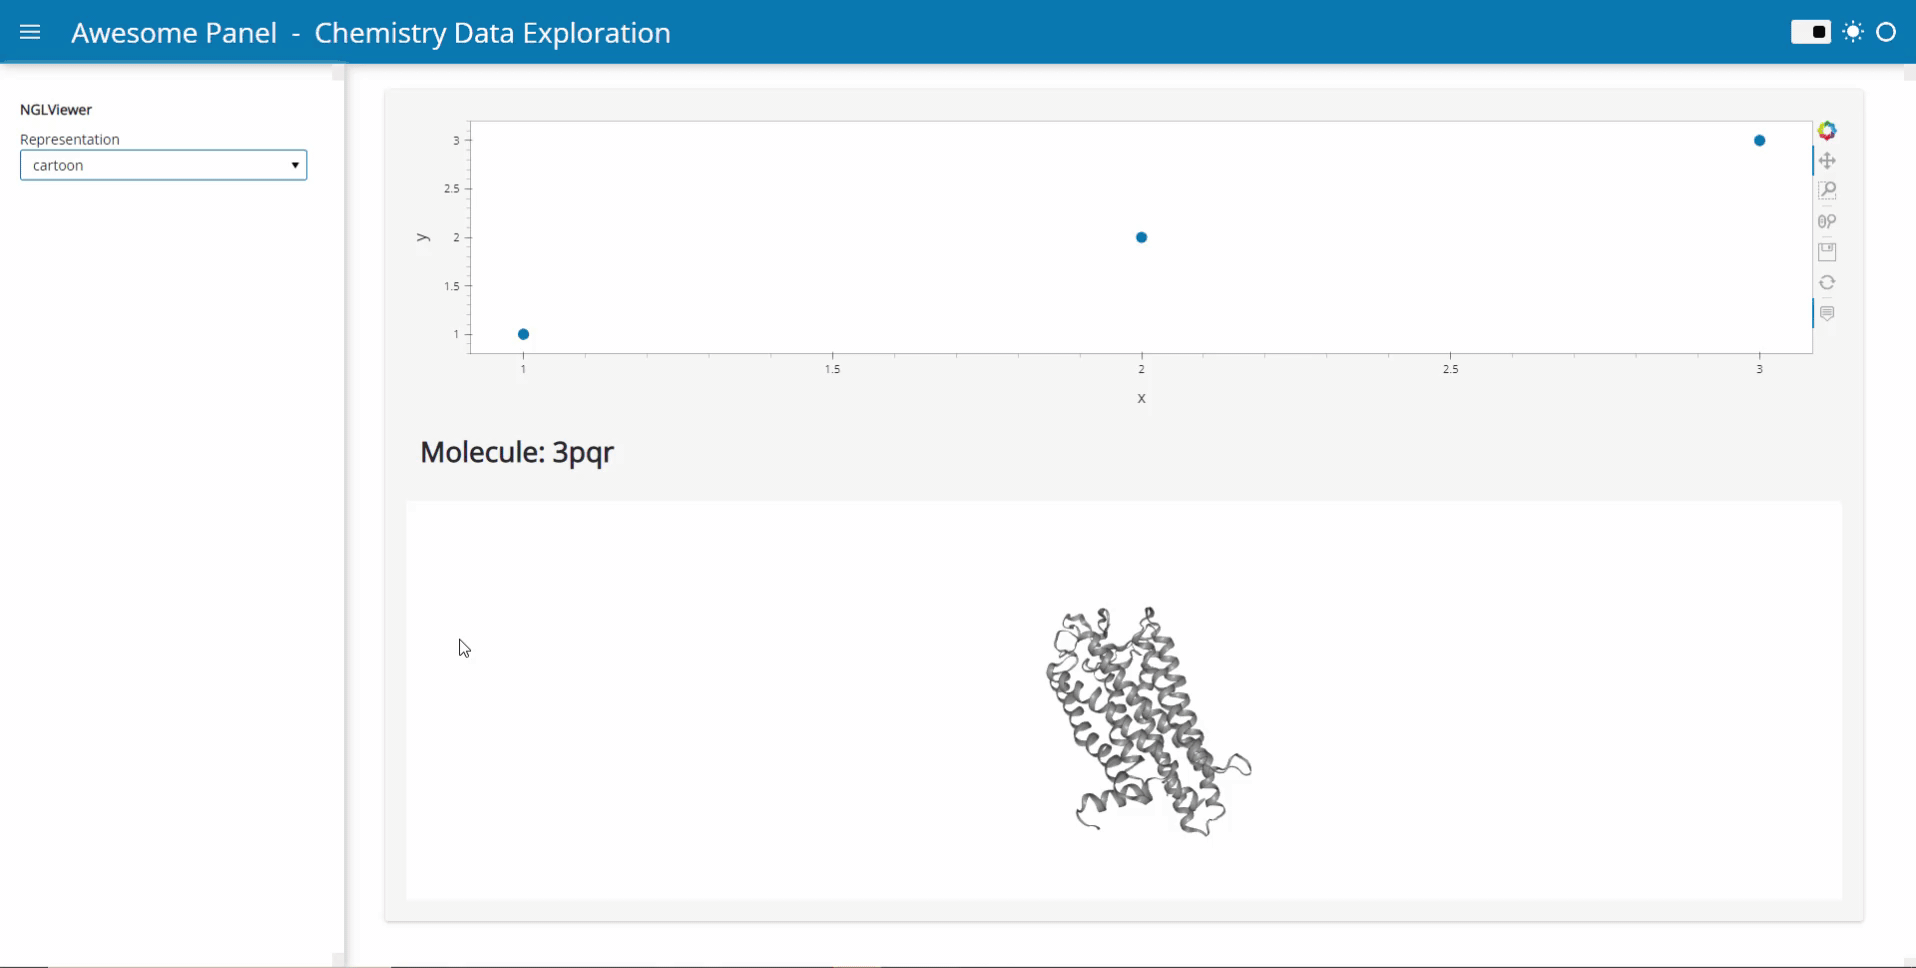
My idea is to link plots to a molecular viewer, e.g. nglview, to show up molecules related to the plot. Along the project, I am demanded to output the location of the file path of the coordinate file of the molecule. I have already managed to integrate the information into the hover view, but I am still struggling on finding the way to link the events on the plot to the molecular viewer.
Within holoviews and the related libraries, the interfaces are well equipped.
Thus, switching elements and plots are quite easy.
However, when I tried to output the information used to communicate between plots to conjugate events on holoview plots to other functions, I couldn’t find the method to extract the information shown up on, for instance, the hover object in stream.
To do this, I guess the program should either continue running on the local machine or require real-time generation of output files triggered by clicking plots to monitoring the events happened on the plot.
If there is any solution with the current version, and if you could share that, I would really appreciate that.
Currently, I’m working on the plot as follows:
import pandas as pd
import holoviews as hv
from bokeh.models import HoverTool
hv.extension('bokeh')

data = {"a": [1.0, 1.0, "path1"], "b": [2.0, 2.0, "path2"], "c": [3.0, 3.0, "path3"]}

# Transformation into Pandas DataFrame objects
df = pd.DataFrame(data, index=["x", "y", "file_path"])

df = df.T

# Which parameter to hover
TOOLTIPS = [("x","@x"),
            ("y","@y"),
            ("file_path","@file_path"),
           ]

# color setting
color_dict = "tab10"

hover = HoverTool(tooltips=TOOLTIPS)

renderer = hv.renderer('bokeh')

# plot setup
plot = hv.Scatter(df,kdims=["x"],vdims=["y"])
plot = plot.add_dimension("file_path",dim_pos=2,vdim=True,dim_val = "file_path")

plot = plot.opts(plot=dict(tools=[hover]))

plot