Hi all,
I am relatively new to holoviews and I am really amazed by the strengths of hvplot. It is really a great library!
I have a question about a figure I am working on (the one on top of the image below):
On this plot I would like to :
- reverse the y axis (so zero is on top and 2500 at the bottom)
- add a “background uniform contour plot” something that could be generated with a function similar to matplotlib’s method fill_between
I generated the figure above with the command:
plot=myXarrayData.hvplot.contourf(z='V', x='refdist', y='depth',
levels=datatoplot['cf_levels'],
clabel=datatoplot['cbtitle'], label=datatoplot['pltitle'])
My aim would be to have a plot similar to the one at the bottom (generated with matplotlib):
Does someone have any advice?
Thank you
After digging the github issue log, I found the solution of using the recent implemented transform
argument:
reversedepth = - hv.dim('depth')
plot=myXarrayData.hvplot.contourf(z='V', x='refdist', y='depth',
transforms=dict(depth=reversedepth)
)
So I am left with my 2nd request. Do you know how I can add this “background plot”?
On matplotlib, I achieved that by first calling contourf on my matplotlib ax object ax.contourf(......)
and then calling ax.fill_between(...)
In order to invert the y axis you can also use : plot.opts(invert_yaxis=True)
For your 2nd request I’m not sure of what you want to do. Maybe a hv.Area between a line at y=3000 and the edge of your plot will do the job.
If you want more help can you provide a small reproducible example please ?
1 Like
Thank you very much @AurelienSciarra for your quick reply. In my case plots.opts(invert_yaxis=True)
didnt work:
The two commands below generated the same plots…
import xarray as xr
import hvplot.xarray
import holoviews as hv
data = np.random.rand(3, 4)
refdist = np.array(range(100,400,100))
depth = np.array(range(5,25,5))
ds = xr.Dataset(
{ "V": (["refdist", "depth"], data),
},
coords={
"refdist": (refdist),
"depth": (depth),
},
)
plot=ds['V'].hvplot.contourf(z='V', x='refdist', y='depth')
plot
plot.opts(invert_yaxis=True)
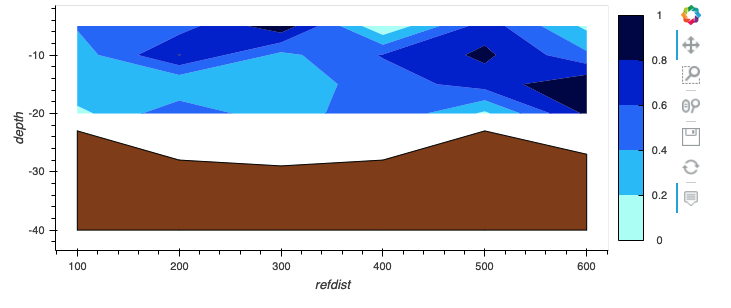
And thank you very much for indicating the element hv.Area. It is perfectly what I need. Following the example on my previous post I managed to overlay my previous example with an hv.Area
object:
From this code:
Y = 20 +np.random.randint(10, size=(len(refdist)))
Y2 = 40*np.ones(Y.shape)
AreaBelowPlot = hv.Area((refdist, -Y, -Y2), vdims=['y', 'y2'])
(pl*AreaBelowPlot).opts(
hv.opts.Area(fill_color='saddlebrown')
)
The overlay functionality is really great!
great job
for the option invert_yaxis=True it seems that there is a bug, the option works with matplotlib backend but don’t with bokeh backend even if the option exist in bokeh.
I was not sure if it was a bug or no. I will open an issue.