I am trying to create filled contours plots using Holoviews that have specified color_level intervals, sometimes as much as 20 different intervals. However, I’ve observed that the contours plot options only correctly maps the first 7 intervals on my plot. I’ve searched on here and on the Holoviews Github issues and not found any report of this issue - I’m hoping someone here might have an answer for why this is happening. I haven’t been able to find an example anywhere online that does exactly what I’m trying here, with at least 10+ color_levels intervals. I have seen people use color_levels=20, but this produces evenly distributed color_levels and is not what I need, they must be in the given intervals. I can’t see why this is happening, and am considering at this point that it is a bug in holoviews, and if so I will report it to the Github. I’ve tinkered a lot with the number of intervals given, and I have come to the conclusion that around the 9th or 10th interval given, the plot starts only using the first 7-8.
I also need to invert my yaxis. The plot automatically displays my y axis with 1000.0 at the top of the plot and 0.0 at the origin, however my y axis values actually start with 1000.0 and end with 0.0, and i need this respected in the plot axis with 1000.0 at the origin and 0.0 at the top of the y axis. Setting invert_yaxis, in addition to invert_xaxis and invert_axes in the options does not produce changes in the plot. This has also been discussed here. I tried to get around this by setting the yticks manually, although the values are updated in the plot, the order of them is still not reflected in the plot. I would appreciate it if anyone knows how to do this.
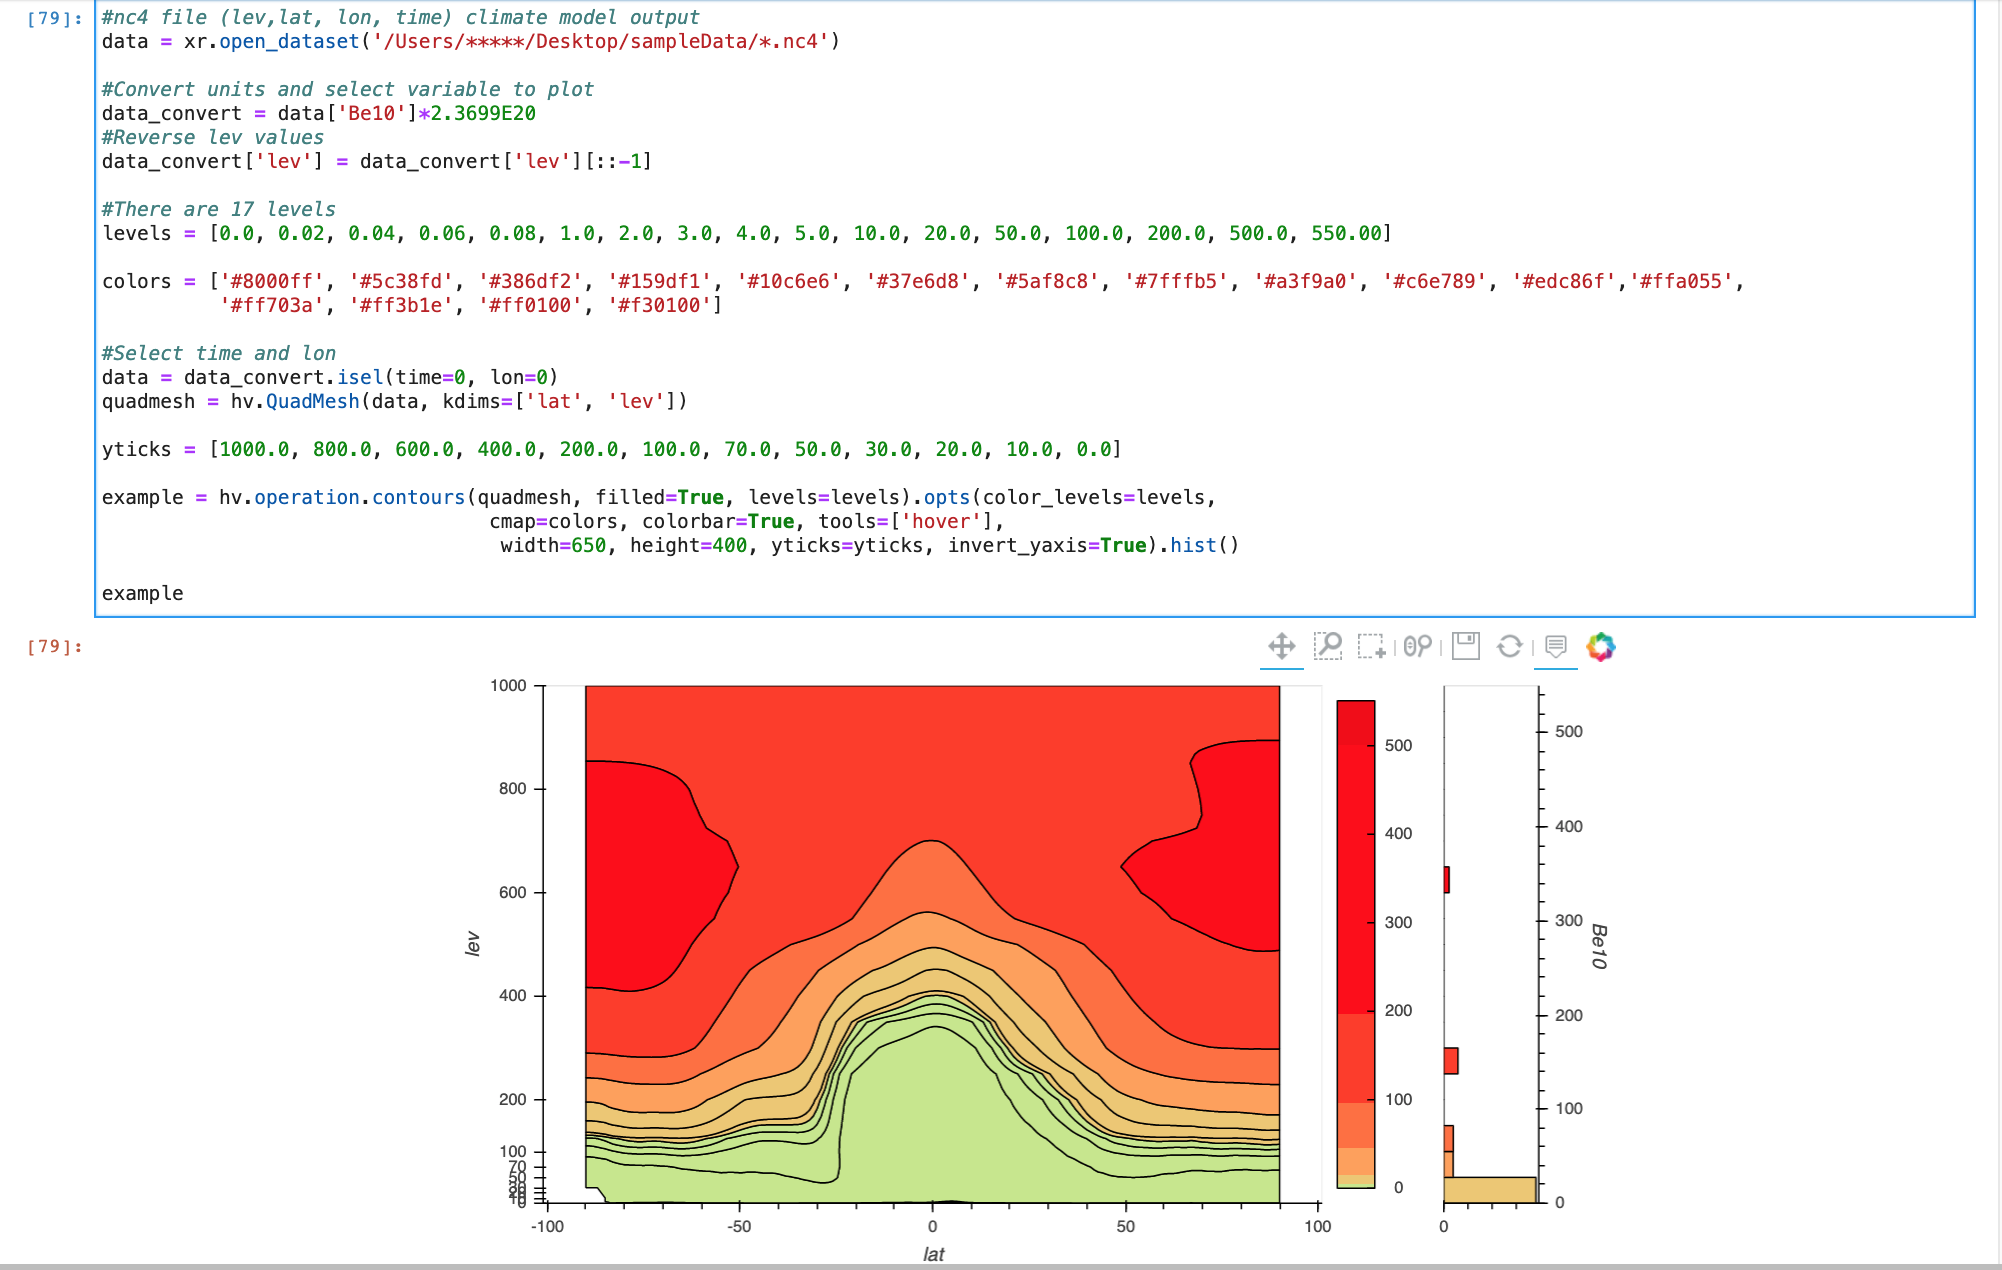
I have attached a screenshot with code and output from using hv.operation.contours. I tried the same thing with hvplot.contour and got the same result, but I’m not allowed to attach more than one image as a new user. This issue reported that color_levels worked correctly in hvplot.contourf so I tried that as well but still reproduced the issue. I also have an image of what I’m trying to replicate that was originally produced in matplotlib of what it should look like but I can’t attach with the limitation.