Is it possible for two DynamicMaps to update each other?

I can have the streams of two DynamicMaps (say dmap1 and dmap2) share the single source, and this source can be one of the dmaps, say dmap1. So, fiddling with dmap1 reflects both dmap1 and dmap2. Is there a way to make this behavior symmetric, so that in addition, when I fiddle with dmap2 it also updates dmap1?

MWE

import numpy as np
import holoviews as hv
hv.extension('bokeh')
from holoviews.streams import RangeX

# create some dummy data
X = np.random.randn(2,10000).cumsum(1)

# function that creates dummy hvElement
# fwiw, in real case I am combining an Image with a Curve
def get_curve(x_range, x, Npoints=100, vdim="_"):
    '''Shows only around 100 points per range together with the curve's envelope.
    If the range is such that the number of data points is smaller than Npoints,
    show them all.
    '''
    t0, t1 = x_range
    t_span = t1-t0
    tt = np.arange(
        max(int(t0),0),
        min(int(t1)+1,x.size)
    )
    xx = x[tt]
    nrebin = int(tt.size//Npoints)
    cs = []
    if nrebin>1:
        tr = tt[:tt.size//nrebin*nrebin].reshape((-1,nrebin))
        xr = xx[:xx.size//nrebin*nrebin].reshape((-1,nrebin))
        cs += [hv.Curve((np.mean(tr,axis=1),np.mean(xr,axis=1)),
                kdims=["time"], vdims=[vdim])]
        cs += [hv.Area((np.mean(tr,axis=1),np.max(xr,axis=1),np.min(xr,axis=1)),
                       kdims=["time"],
                       vdims=[vdim,vdim+"_"],
                      ).opts(alpha= .5,line_width=0)]
    else:
        cs = [hv.Curve((tt,xx), kdims=["time"], vdims=[vdim])]
    return hv.Overlay(cs).opts(width=800, height=200)

# test the function is need
# get_curve((0,X.shape[1]),X[0])
# get_curve((0,X.shape[1]/100),X[0])

# construct dynamic maps
xrange = RangeX(x_range=(0,X.shape[1]))
dmap1 = hv.DynamicMap(lambda x_range: get_curve(x_range,X[0],vdim='a'), streams=[xrange])
dmap2 = hv.DynamicMap(lambda x_range: get_curve(x_range,X[1],vdim='b'), streams=[xrange])

(dmap1+dmap2).cols(1)
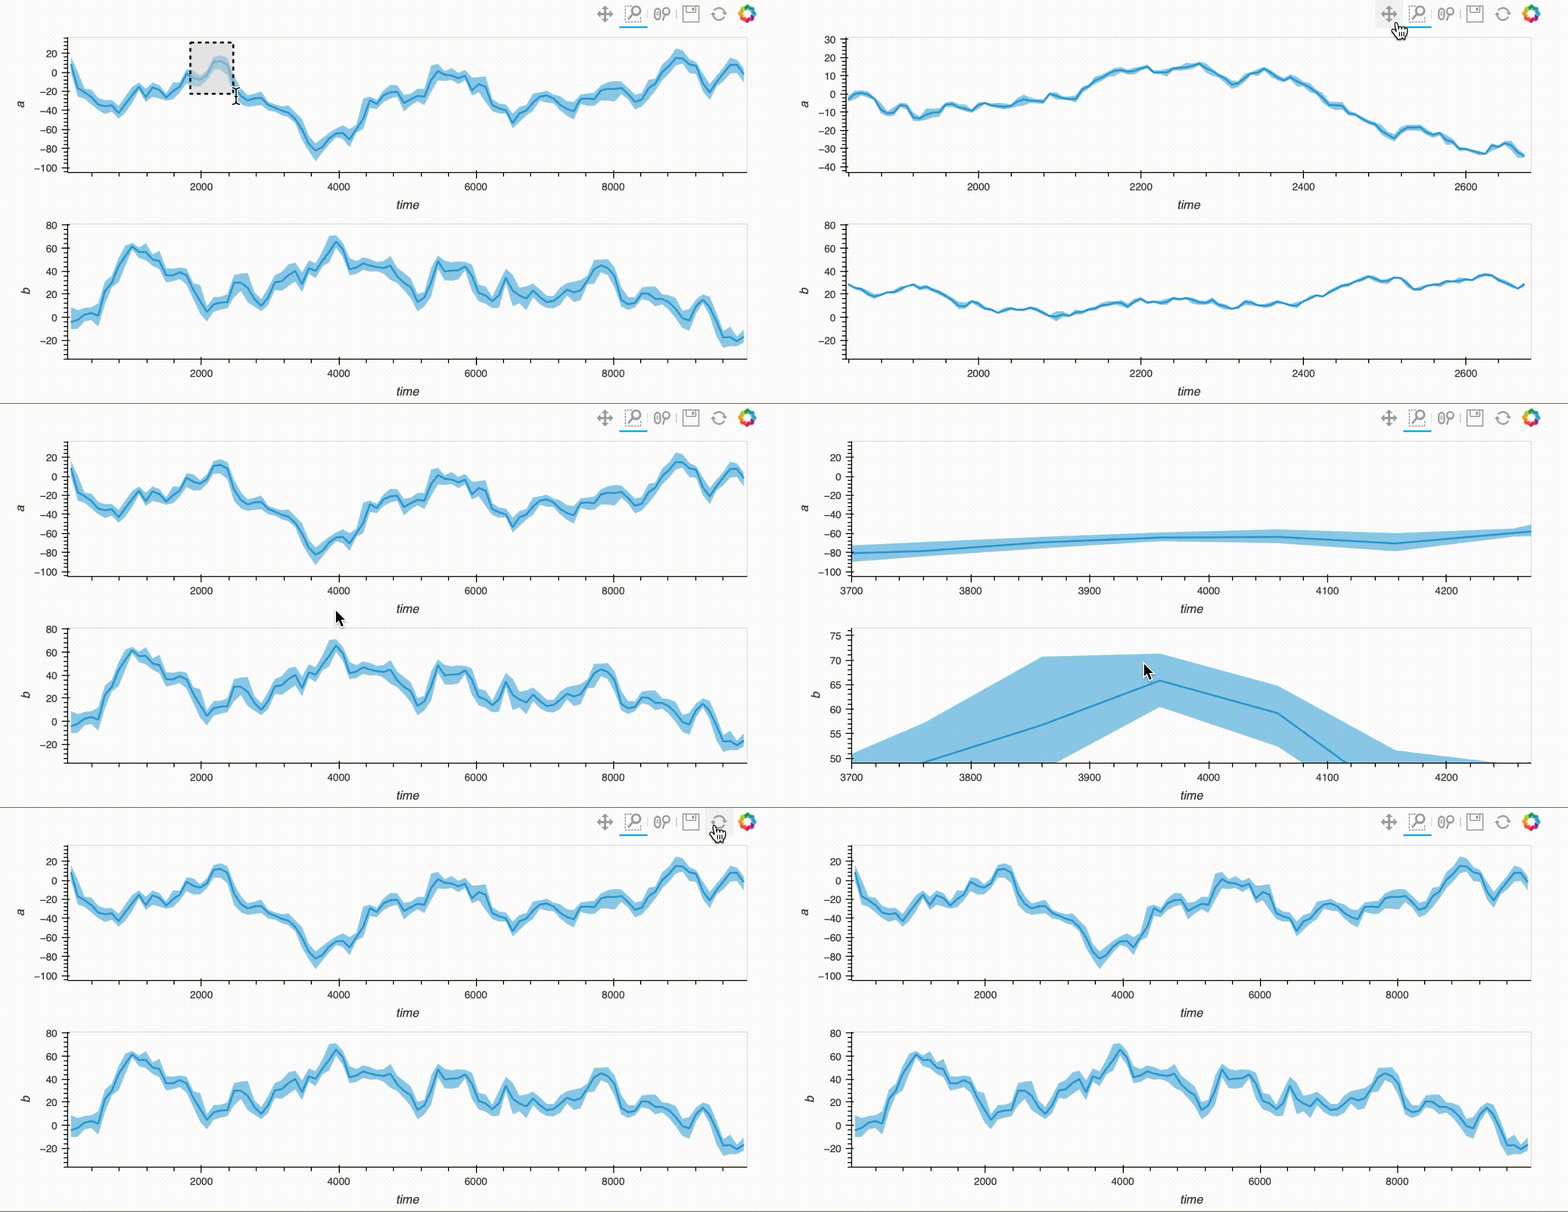
recording

I’ve tried having separate streams, and combining them post creation, but unsurprisingly this led to a clash on x_range's.

xrange1 = RangeX(x_range=(0,X.shape[1]))
xrange2 = RangeX(x_range=(0,X.shape[1]))
dmap1 = hv.DynamicMap(lambda x_range: get_curve(x_range,X[0],vdim='a'), streams=[xrange1])
dmap2 = hv.DynamicMap(lambda x_range: get_curve(x_range,X[1],vdim='b'), streams=[xrange2])
dmap1.streams += [xrange2]
dmap2.streams += [xrange1]
hv.Layout([dmap1,dmap2]).cols(1)
# output:
# Exception: The supplied stream objects RangeX(x_range=(0, 10000)) and
# RangeX(x_range=(0, 10000)) clash on the following parameters: ['x_range']`

Are you running the latest holoviews version?

This was on holoviews 1.15.0. updated to 1.15.2, and the same outcome.

This works for me on the latest holoviews release.

dmap1 = hv.DynamicMap(
    lambda x_range: get_curve(x_range, X[0], vdim="a"), streams=[RangeX(x_range=(0, X.shape[1]))]
)
dmap2 = hv.DynamicMap(
    lambda x_range: get_curve(x_range, X[1], vdim="b"), streams=[RangeX(x_range=(0, X.shape[1]))]
)

(dmap1 + dmap2).cols(1)
1 Like

I don’t understand how I did not try this. So simple. Thank you.

I know there has been some problem with this, which was fixed in v1.15.1. So you could have tried this on v1.15.0 with no success.

1 Like

Hi Both

I looked at the example and I simple don’t understand what you are trying to achieve? Don’t you get the same behaviour if you drop the DynamicMaps and RangeX stream with

dmap1= get_curve((0,X.shape[1]), X[0], vdim='a')
dmap2= get_curve((0,X.shape[1]), X[1], vdim='b')

import holoviews as hv
import numpy as np
import panel as pn
from holoviews.streams import RangeX

hv.extension('bokeh')

X = np.random.randn(2,10000).cumsum(1)

def get_curve(x_range, x, Npoints=100, vdim="_"):
    '''Shows only around 100 points per range together with the curve's envelope.
    If the range is such that the number of data points is smaller than Npoints,
    show them all.
    '''
    t0, t1 = x_range
    t_span = t1-t0
    tt = np.arange(
        max(int(t0),0),
        min(int(t1)+1,x.size)
    )
    xx = x[tt]
    nrebin = int(tt.size//Npoints)
    cs = []
    if nrebin>1:
        tr = tt[:tt.size//nrebin*nrebin].reshape((-1,nrebin))
        xr = xx[:xx.size//nrebin*nrebin].reshape((-1,nrebin))
        cs += [hv.Curve((np.mean(tr,axis=1),np.mean(xr,axis=1)),
                kdims=["time"], vdims=[vdim])]
        cs += [hv.Area((np.mean(tr,axis=1),np.max(xr,axis=1),np.min(xr,axis=1)),
                       kdims=["time"],
                       vdims=[vdim,vdim+"_"],
                      ).opts(alpha= .5,line_width=0)]
    else:
        cs = [hv.Curve((tt,xx), kdims=["time"], vdims=[vdim])]
    return hv.Overlay(cs).opts(width=800, height=200)

dmap1 = hv.DynamicMap(
    lambda x_range: get_curve(x_range, X[0], vdim="a"), streams=[RangeX(x_range=(0, X.shape[1]))]
)
dmap2 = hv.DynamicMap(
    lambda x_range: get_curve(x_range, X[1], vdim="b"), streams=[RangeX(x_range=(0, X.shape[1]))]
)
dmap1= get_curve((0,X.shape[1]), X[0], vdim='a')
dmap2= get_curve((0,X.shape[1]), X[1], vdim='b')
pn.panel((dmap1 + dmap2).cols(1)).servable()

Ahh. You are trying to enable some kind of dynamic zoom where you are always showing maximum 100 points?

1 Like

Yes. I wish the figure to be very lightweight.

1 Like