Hi all,
I’m building a plot and need to add the formula for each component as part of the legend. As of now, the best that I could do is to write the formula in text format. It would be really nice if I could write them in latex format though. I have tried so many things, none seems to work. Any tip is appreciated.
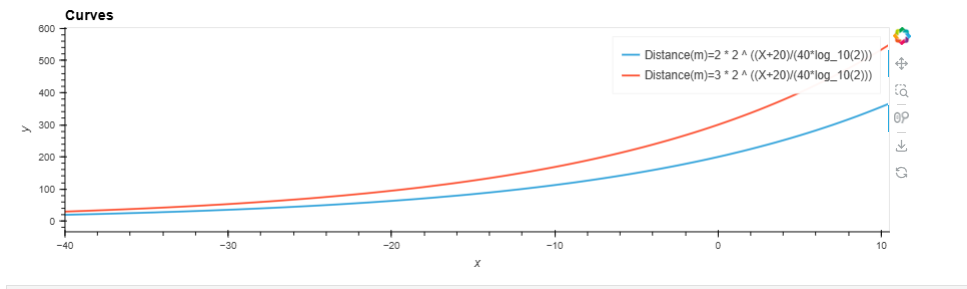
Here’s a working example:
import holoviews as hv
import numpy as np
import panel as pn

pn.extension('katex')

X_VALUES = np.arange(-40, 11, 0.5).round(1)

def calc_points(
    coefficient: int, x: np.array = X_VALUES
) -> list:
    return np.column_stack(
        (
            x,
            (coefficient * 10 ** (x / 40 + 2)).round(1),
        )
    ).tolist()

def create_curve(coefficient: int):
    label = f"Distance(m)={str(coefficient)} * 2 ^ ((X+20)/(40*log_10(2)))"
    points = calc_points(coefficient=coefficient, x=X_VALUES)
    curve = hv.Curve(points,label=label,group="curve").opts(width=1000, show_legend=True)
    return curve

curve1 = create_curve(2)
curve2 = create_curve(3)

pn.panel((curve1 * curve2).opts(title="Curves"))