Is it possible to change hvplot's hover position?

Hi there,

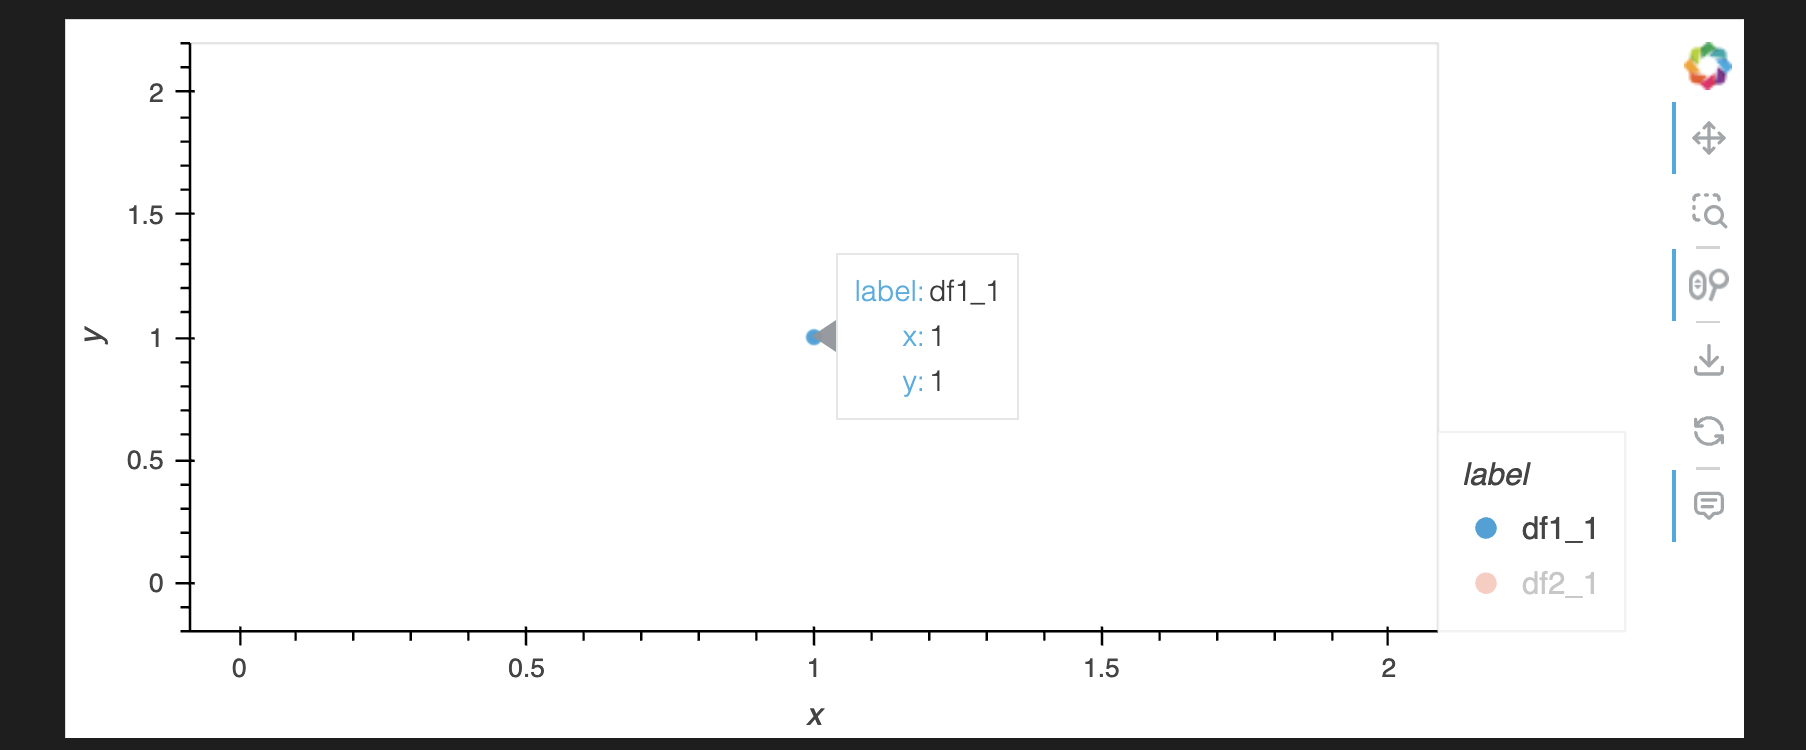
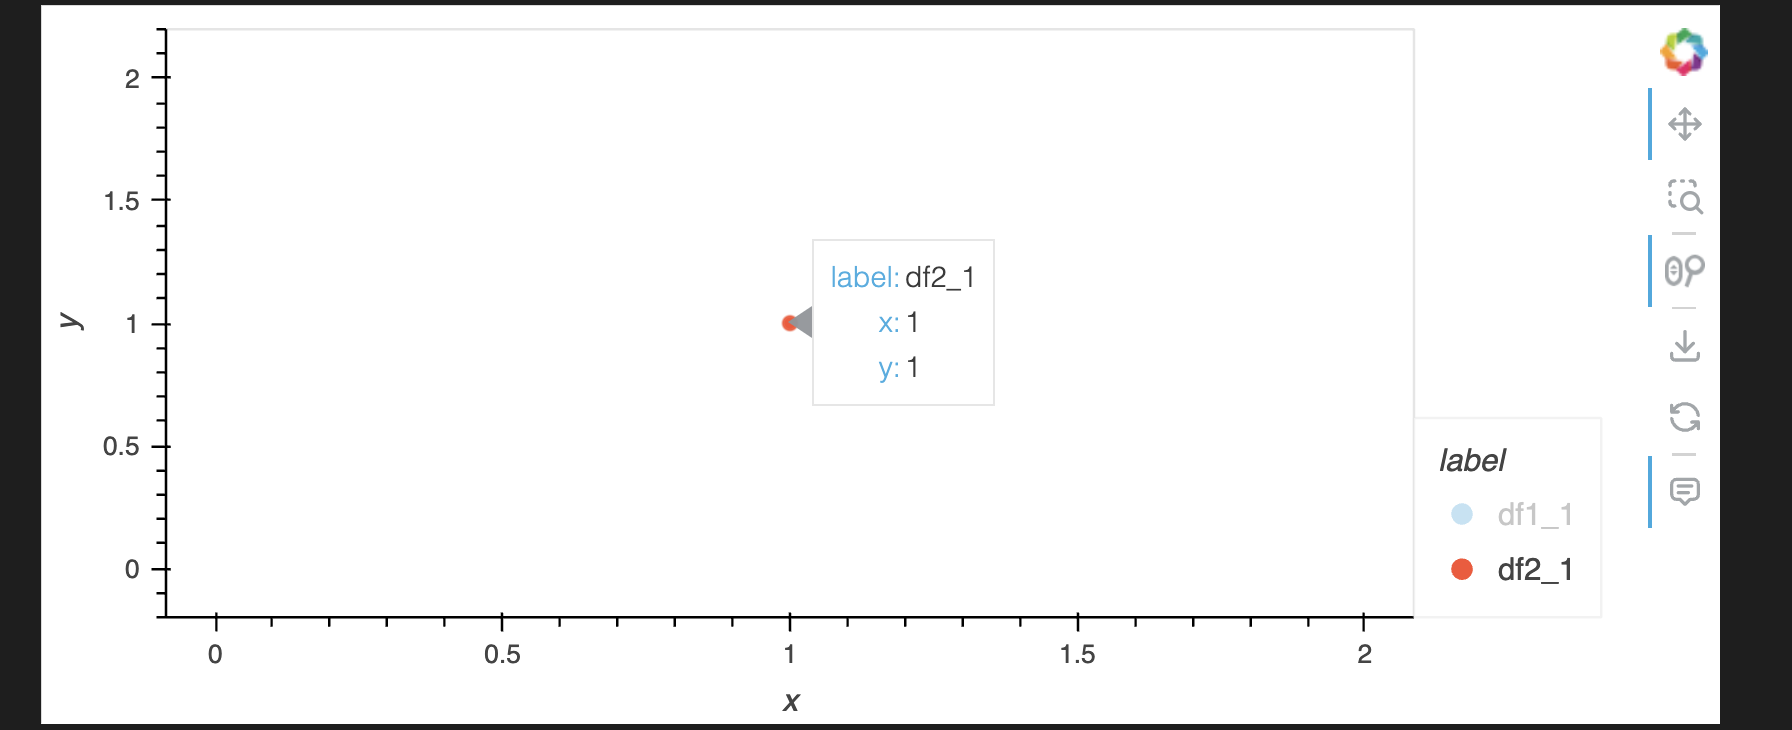
I’ve overlaid 3 polygons and I’m trying to read the hover boxes but unfortunately they hide one another. Minimal reproducible example (using points instead of polygons):

import pandas as pd
import hvplot.pandas

df1 = pd.DataFrame({
    'x': [1],
    'y': [1],
    'label': ["df1_1"],
})
df2 = pd.DataFrame({
    'x': [1],
    'y': [1],
    'label': ["df2_1"],
})

df1.hvplot.scatter(x='x', y='y', c="label") * df2.hvplot.scatter(x='x', y='y', c="label")

(Regarding the image below: the hover info is showing for df2 but not df1)
image

Is it possible to change hvplot’s hover position (so that I can see the hover info for df1 and df2)?

Many thanks for any help, and this amazing libs!

2 Likes

Hi @ILoveHVPlot

Welcome to the community. Love your name :wink:

I don’t know of a solution, but please consider posting a minimum, reproducible example and a small video showing the issue. It will make it easy for someone with the knowledge to try to help.

1 Like

Are you able to preprocess/join the polygons into one multipolygon first?

Or try reordering the overlays (e.g. a * b * c to b * a * c).

Also, maybe disabling some polygons hover?

Thanks for the suggestions, I’ve tried these with no joy unfortunately - I’ve added a minimal reproducible example if helpful.

Here’s one solution: hiding the points with interactive legend:

import pandas as pd
import hvplot.pandas

df1 = pd.DataFrame({
    'x': [1],
    'y': [1],
    'label': ["df1_1"],
})
df2 = pd.DataFrame({
    'x': [1],
    'y': [1],
    'label': ["df2_1"],
})


pd.concat([df1, df2]).hvplot.scatter(x="x", y="y", by="label", hover="vline").opts(legend_opts={"click_policy": "hide"})


I really appreciate you help @ahuang11, this works well thanks - just wondering, is there any documentation that I can read more about options like legend_opts?

Thanks again!!

Hmm, I actually can’t find much docs on it :frowning:

Can you help submit an issue on Issues · holoviz/holoviews · GitHub or hvplot to document legend_opts, and perhaps maybe copy the following snippet:

It’s key that you understand that hvplot is built off HoloViews, so anything that works in HoloViews should work on hvplot objects (which are mostly HoloViews objects, except in some cases)–that means, hv.help(df.hvplot(...)) will work, and that will list out all the options associated with the plot. If it’s a Layout/DynamicMap/HoloMap/Overlay, you have to figure out the base element, and do something like hv.help(hv.Scatter) or else you’re just getting options on those containers.

After that if you don’t find what you need, you need to dig deep into the backend and find the associated options. So here, because it’s bokeh, I looked up Bokeh’s issues + discourse
(Hover responds to hidden data when legend.click_policy = 'hide' · Issue #6120 · bokeh/bokeh · GitHub) and searched for hover tooltips overlaying.

1 Like

Created: Missing documentation on `legend_opts` · Issue #1233 · holoviz/hvplot · GitHub (I think this is what you requested, but please feel free to add more info to that issue if helpful).

Many thanks again for all your help!