Is it possible to combine bar and curve plot using holoviews?

Hi everyone!

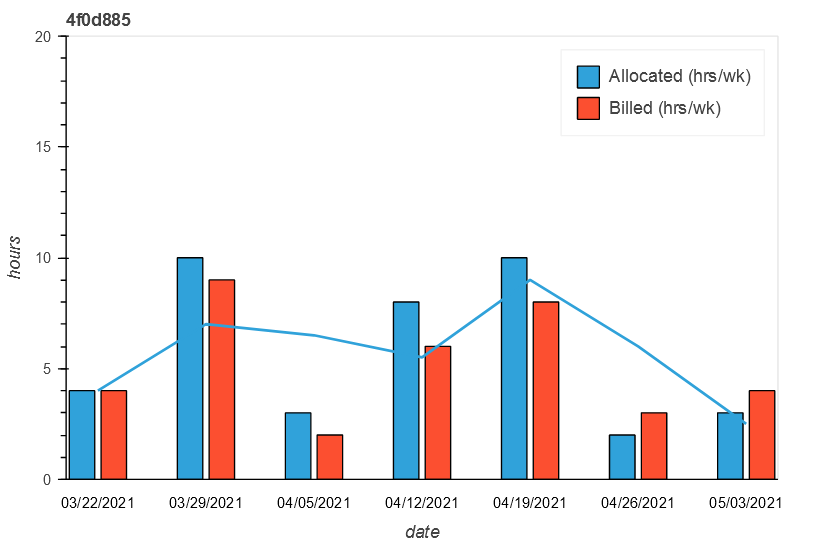
is it possible to combine a bar and a curve plot using holoviews?

this is my example

tuple = [('03/22/2021', 'Allocated (hrs/wk)', 4.0),
 ('03/29/2021', 'Allocated (hrs/wk)', 10.0),
 ('04/05/2021', 'Allocated (hrs/wk)', 3.0),
 ('04/12/2021', 'Allocated (hrs/wk)', 8.0),
 ('04/19/2021', 'Allocated (hrs/wk)', 10.0),
 ('04/26/2021', 'Allocated (hrs/wk)', 2.0),
 ('05/03/2021', 'Allocated (hrs/wk)', 3.0),
 ('03/22/2021', 'Billed (hrs/wk)', 4.0),
 ('03/29/2021', 'Billed (hrs/wk)', 9.0),
 ('04/05/2021', 'Billed (hrs/wk)', 2.0),
 ('04/12/2021', 'Billed (hrs/wk)', 6.0),
 ('04/19/2021', 'Billed (hrs/wk)', 8.0),
 ('04/26/2021', 'Billed (hrs/wk)', 3.0),
 ('05/03/2021', 'Billed (hrs/wk)', 4.0)]

plot_data = [
    ('2021.03.22', 4.0),
    ('2021.03.29', 7.0),
    ('2021.04.05', 6.5),
    ('2021.04.12', 5.5),
    ('2021.04.19', 9.0),
    ('2021.04.26', 6.0),
    ('2021.05.03', 2.5)]

group = "4f0d885"
ymax = 20

plot = hv.Bars(tuples, ["date", "hours_type"], ["hours"]).opts(
    title=f"{group}",
    stacked=False,
    multi_level=False,
    height=400,
    width=600,
    active_tools=["pan"],
    ylim=(0, ymax),
)

curve_plot = hv.Curve(plot_data, 'date', "Allocated (hrs/wk)").options(
    title=f"{group}",
    height=400,
    width=600,
    active_tools=["pan"],
    ylim=(0, ymax),
)

display(plot)
display(curve_plot)

it works fine, but if I try to display (using jupyter notebook) display(plot * curve_plot), it doesn’t work:

ValueError: all the input arrays must have same number of dimensions, but the array at index 0 has 2 dimension(s) and the array at index 1 has 1 dimension(s)
:Overlay
   .Bars.I  :Bars   [date,hours_type]   (hours)
   .Curve.I :Curve   [date]   (Allocated (hrs/wk))

does someone has any idea about this problem and how to fix it? thanks!

I can also confirm there is a problem. Here I don’t overlay the plots but display them in the same Panel app

ValueError: failed to validate FactorRange(id='3092', ...).factors: expected an element of either Seq(String), Seq(Tuple(String, String)) or Seq(Tuple(String, String, String)), got [('03/22/2021', 'Allocated (hrs/wk)'), ('03/22/2021', 'Billed (hrs/wk)'), ('03/29/2021', 'Allocated (hrs/wk)'), ('03/29/2021', 'Billed (hrs/wk)'), ('04/05/2021', 'Allocated (hrs/wk)'), ('04/05/2021', 'Billed (hrs/wk)'), ('04/12/2021', 'Allocated (hrs/wk)'), ('04/12/2021', 'Billed (hrs/wk)'), ('04/19/2021', 'Allocated (hrs/wk)'), ('04/19/2021', 'Billed (hrs/wk)'), ('04/26/2021', 'Allocated (hrs/wk)'), ('04/26/2021', 'Billed (hrs/wk)'), ('05/03/2021', 'Allocated (hrs/wk)'), ('05/03/2021', 'Billed (hrs/wk)'), '2021.03.22', '2021.03.29', '2021.04.05', '2021.04.12', '2021.04.19', '2021.04.26', '2021.05.03']
import panel as pn
import holoviews as hv

pn.extension()
hv.extension("bokeh")

tuples = [('03/22/2021', 'Allocated (hrs/wk)', 4.0),
 ('03/29/2021', 'Allocated (hrs/wk)', 10.0),
 ('04/05/2021', 'Allocated (hrs/wk)', 3.0),
 ('04/12/2021', 'Allocated (hrs/wk)', 8.0),
 ('04/19/2021', 'Allocated (hrs/wk)', 10.0),
 ('04/26/2021', 'Allocated (hrs/wk)', 2.0),
 ('05/03/2021', 'Allocated (hrs/wk)', 3.0),
 ('03/22/2021', 'Billed (hrs/wk)', 4.0),
 ('03/29/2021', 'Billed (hrs/wk)', 9.0),
 ('04/05/2021', 'Billed (hrs/wk)', 2.0),
 ('04/12/2021', 'Billed (hrs/wk)', 6.0),
 ('04/19/2021', 'Billed (hrs/wk)', 8.0),
 ('04/26/2021', 'Billed (hrs/wk)', 3.0),
 ('05/03/2021', 'Billed (hrs/wk)', 4.0)]

plot_data = [
    ('2021.03.22', 4.0),
    ('2021.03.29', 7.0),
    ('2021.04.05', 6.5),
    ('2021.04.12', 5.5),
    ('2021.04.19', 9.0),
    ('2021.04.26', 6.0),
    ('2021.05.03', 2.5)]

group = "4f0d885"
ymax = 20

plot = hv.Bars(tuples, ["date", "hours_type"], ["hours"]).opts(
    title=f"{group}",
    stacked=False,
    multi_level=False,
    height=400,
    width=600,
    active_tools=["pan"],
    ylim=(0, ymax),
)

curve_plot = hv.Curve(plot_data, 'date', "Allocated (hrs/wk)").options(
    title=f"{group}",
    height=400,
    width=600,
    active_tools=["pan"],
    ylim=(0, ymax),
)

pn.Column(
    pn.pane.HoloViews(plot),
    pn.pane.HoloViews(curve_plot),
).servable()

I think that the problem is that Bars is intended for discrete, categorial x-axis and Curve for continues, numerical axis.

You can overlay a Histogram and Curve. But I cannot see how that would support the additional hours_group dimension.

import panel as pn
import holoviews as hv
import pandas as pd

pn.extension(sizing_mode="stretch_width")
hv.extension("bokeh")

tuples1 = (
    (pd.Timestamp('04/26/2021'), pd.Timestamp('05/03/2021')), (2.0, 3.0),
)
plot_data = [
    (pd.Timestamp('05/04/2021'), 6.5),
    (pd.Timestamp('26/04/2021'), 6.0),
]

plot1 = hv.Histogram(tuples1).opts(color="purple", padding=0.1)

curve_plot = hv.Curve(plot_data, "date", "Allocated").opts(line_width=8, color="green")

pn.Column(
    pn.pane.HoloViews(plot1*curve_plot),
).servable()

I don’t know if it will fit your need but you can overlay both plot using bokeh renderer.

import panel as pn
import holoviews as hv

pn.extension()
hv.extension("bokeh")

tuples = [('03/22/2021', 'Allocated (hrs/wk)', 4.0),
 ('03/29/2021', 'Allocated (hrs/wk)', 10.0),
 ('04/05/2021', 'Allocated (hrs/wk)', 3.0),
 ('04/12/2021', 'Allocated (hrs/wk)', 8.0),
 ('04/19/2021', 'Allocated (hrs/wk)', 10.0),
 ('04/26/2021', 'Allocated (hrs/wk)', 2.0),
 ('05/03/2021', 'Allocated (hrs/wk)', 3.0),
 ('03/22/2021', 'Billed (hrs/wk)', 4.0),
 ('03/29/2021', 'Billed (hrs/wk)', 9.0),
 ('04/05/2021', 'Billed (hrs/wk)', 2.0),
 ('04/12/2021', 'Billed (hrs/wk)', 6.0),
 ('04/19/2021', 'Billed (hrs/wk)', 8.0),
 ('04/26/2021', 'Billed (hrs/wk)', 3.0),
 ('05/03/2021', 'Billed (hrs/wk)', 4.0)]

plot_data = [
    ('03/22/2021', 4.0),
    ('03/29/2021', 7.0),
    ('04/05/2021', 6.5),
    ('04/12/2021', 5.5),
    ('04/19/2021', 9.0),
    ('04/26/2021', 6.0),
    ('05/03/2021', 2.5)]

group = "4f0d885"
ymax = 20

plot = hv.Bars(tuples, ["date", "hours_type"], ["hours"]).opts(
    title=f"{group}",
    stacked=False,
    multi_level=False,
    height=400,
    width=600,
    active_tools=["pan"],
    ylim=(0, ymax),
)

curve_plot = hv.Curve(plot_data, 'date', "hours").options(
    title=f"{group}",
    height=400,
    width=600,
    active_tools=["pan"],
    ylim=(0, ymax),
)

curve_rend = hv.render(curve_plot)
rend = hv.render(plot)
curve_rend.x_range = rend.x_range
rend.renderers+=curve_rend.renderers
pn.pane.Bokeh(rend).show()

5 Likes

thanks @AurelienSciarra, very nice and simple solution! thanks a lot!

Thanks @Marc for all the examples and explanations!

Awesome @AurelienSciarra . Did not know that method.