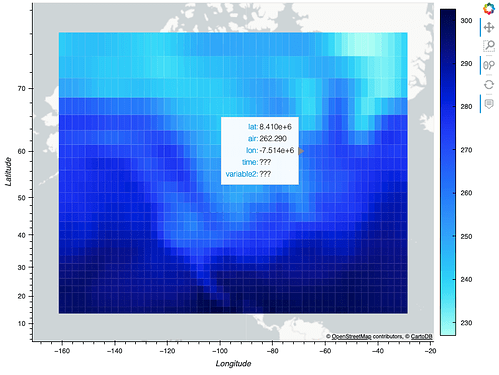
I would like to have a hover tool that displays the data associated with a QuadMesh polygon for all variables in a file. However, in order to get QuadMesh to work I have needed to pass 1 value dimension and it appears the additional variable data is lost. Here is a minimal example:
import geoviews as gv
import panel as pn
import xarray as xr
from bokeh.models import HoverTool

gv.extension('bokeh')

ds = xr.tutorial.open_dataset('air_temperature')
ds = ds.isel(time=0)
ds['variable2'] = ds['air'] * 2

hover = HoverTool(tooltips=[(var, f'@{var}') for var in ds.variables])
qmesh = gv.Dataset(ds).to(gv.QuadMesh, ['lon', 'lat'], ['air'])
qmesh = qmesh.opts(gv.opts.QuadMesh(colorbar=True, tools=[hover]))
plot = gv.tile_sources.CartoLight * qmesh
pn.pane.Pane(plot.opts(width=800, height=600)).servable()
If I instead try
qmesh = gv.Dataset(ds).to(gv.QuadMesh, ['lon', 'lat'], ['air', 'variable2'])
I get the following error
    raise DataError(error)
holoviews.core.data.interface.DataError: None of the available storage backends were able to support the supplied data format.
Is this possible? I do have an existing app that can do this using bokeh directly with a FeatureCollection GeoJSONDataSource.
Hi @zdgriffith and welcome. This is a indeed a very natural usecase and hover_cols pops to mind. If you are ok to use hvplot it would look like this:
import geoviews as gv
import panel as pn
import xarray as xr
import hvplot.xarray

gv.extension('bokeh')

ds = xr.tutorial.open_dataset('air_temperature')
ds = ds.isel(time=0)
ds['variable2'] = ds['air'] * 2

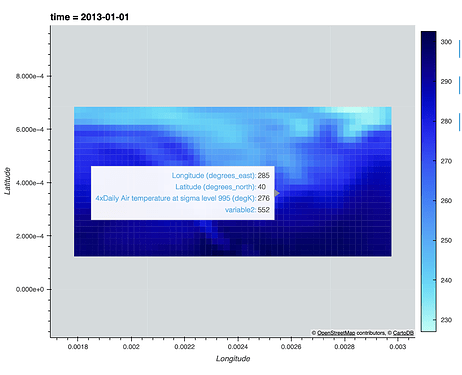
qmesh = ds.hvplot.quadmesh(x='lon',y= 'lat',z=['air','variable2'],hover_cols=['variable2'])
qmesh = qmesh.opts(gv.opts.QuadMesh(colorbar=True, tools=['hover']))

plot = gv.tile_sources.CartoLight * qmesh
pn.pane.HoloViews(plot.opts(width=800, height=600)).servable()
Of course hvplot uses holoviews and certainly a custom HoverTool so you can check the source code if you want to understand the right syntax to achieve this without hvplot.
1 Like
@marcbernot thank you for the suggestion, that does achieve the extra hover columns I want.
However if I try to apply a PlateCarree projection by adding geo=True I get the same errors I am seeing in my full application code.
  File "/home/zgriffith/mambaforge/envs/panel/lib/python3.10/site-packages/holoviews/core/data/interface.py", line 268, in initialize
    raise DataError(error)
holoviews.core.data.interface.DataError: None of the available storage backends were able to support the supplied data format.
I tried dropping in with a debugger to see what the actual problem is here:
ipdb> eltype
<class 'geoviews.element.geo.QuadMesh'>
ipdb> type(data), len(data)
(<class 'tuple'>, 3)
ipdb> kdims
[Dimension('lon', label='Longitude', unit='degrees_east'), Dimension('lat', label='Latitude', unit='degrees_north')]
ipdb> vdims
[Dimension('air', label='4xDaily Air temperature at sigma level 995', unit='degK'), Dimension('variable2', label='test', unit='test')]
ipdb> prioritized
[<class 'holoviews.core.data.xarray.XArrayInterface'>, <class 'holoviews.core.data.grid.GridInterface'>]
ipdb> prioritized[0].init(eltype, data, kdims, vdims)
*** KeyError: 'variable2'
ipdb> prioritized[1].init(eltype, data, kdims, vdims)
*** ValueError: Values for dimension variable2 not found
The data tuple is (lat, lon, air) - it seems like incorporating geoviews is dropping that extra data along the way.
Have a look at these two posts by @Hoxbro, it could give you a way forward.
Post1 custom hover and post2 hook for custom hover.
thanks again, I am actually already using Haxbro’s post1 solution in my app to great effect. However, I’m not coming up with a way to use that for the problem I’m having here as the issue seems to be the extra vdim data not getting passed through to the interface initialization.
I’ll take the hvplot solution you provided with/without geo=True and make an issue in the repo.

