Sometimes I come across the need to ensure alignment of holoviews plots in a layout based on where the frames either start or end in horizontal or vertical direction. I am not sure if this question is really a bokeh question or holoviews question, but try here first. It could be situations when you got two or more plots and the width of the formatted label ticks are quite different. Then sometimes the plots organized in a column layout might not align for xaxis based on where the frame starts from the left side.
I was wondering if there is a concept of frame alignment (top, bottom, left, right) in holoviews using bokeh backend? I must say I really love the ‘frame_height’ and ‘frame_width’ as opposed to only having ‘height’ and ‘width’ as arguments to elements. These provide ways to have the output much more as one expect it. So hoping there is also something similar for frame aligment.
Here comes a constructed example trying to illustrate the point.
# Imports
import pandas as pd
import numpy as np
import holoviews as hv
from holoviews import opts

# load bokeh extension
hv.extension('bokeh')

# Create dummy data
xs = np.linspace(10,20, 11)
y1 = np.random.random(len(xs)) # .cumsum()
y2 = y.cumsum()
y3 = -xs**1/3


data = {
    'x': xs,
    'y1': y1,
    'y2': y2,
    'y3': y3
}

df = pd.DataFrame(data)

size_opts = dict(frame_width=800, frame_height=90)
(
    hv.Curve(df, kdims='x', vdims='y1')
    + hv.Scatter(df, 'x', 'y2').opts(size=9)
    + hv.Curve(df, 'x', 'y3').opts(yticks=[(-7,'lower'), (-5, 'some center'), (-3, 'top')], fontsize={'ylabel': '12pt', 'yticks': '12pt'})
).cols(1).opts(opts.Curve(**size_opts), opts.Scatter(**size_opts))
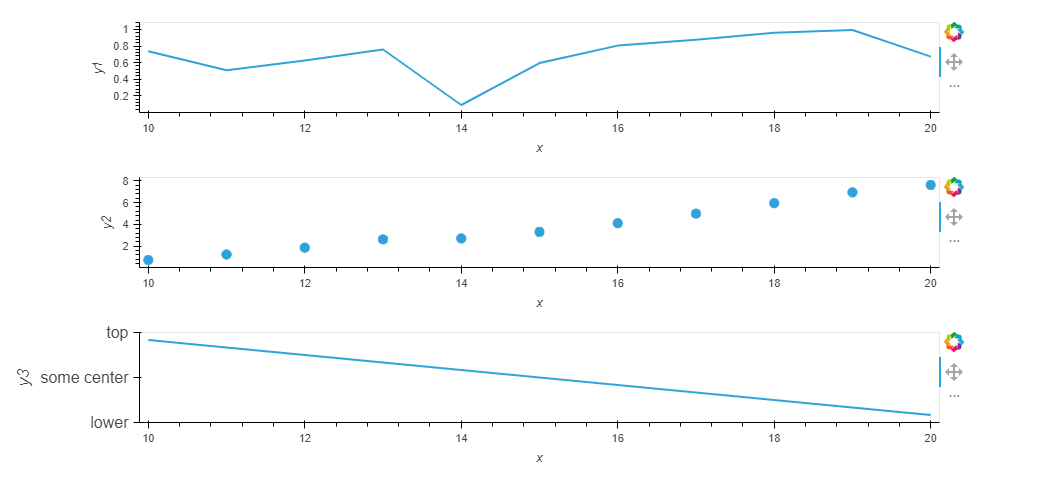
Output as beeing plotted in a notebook:
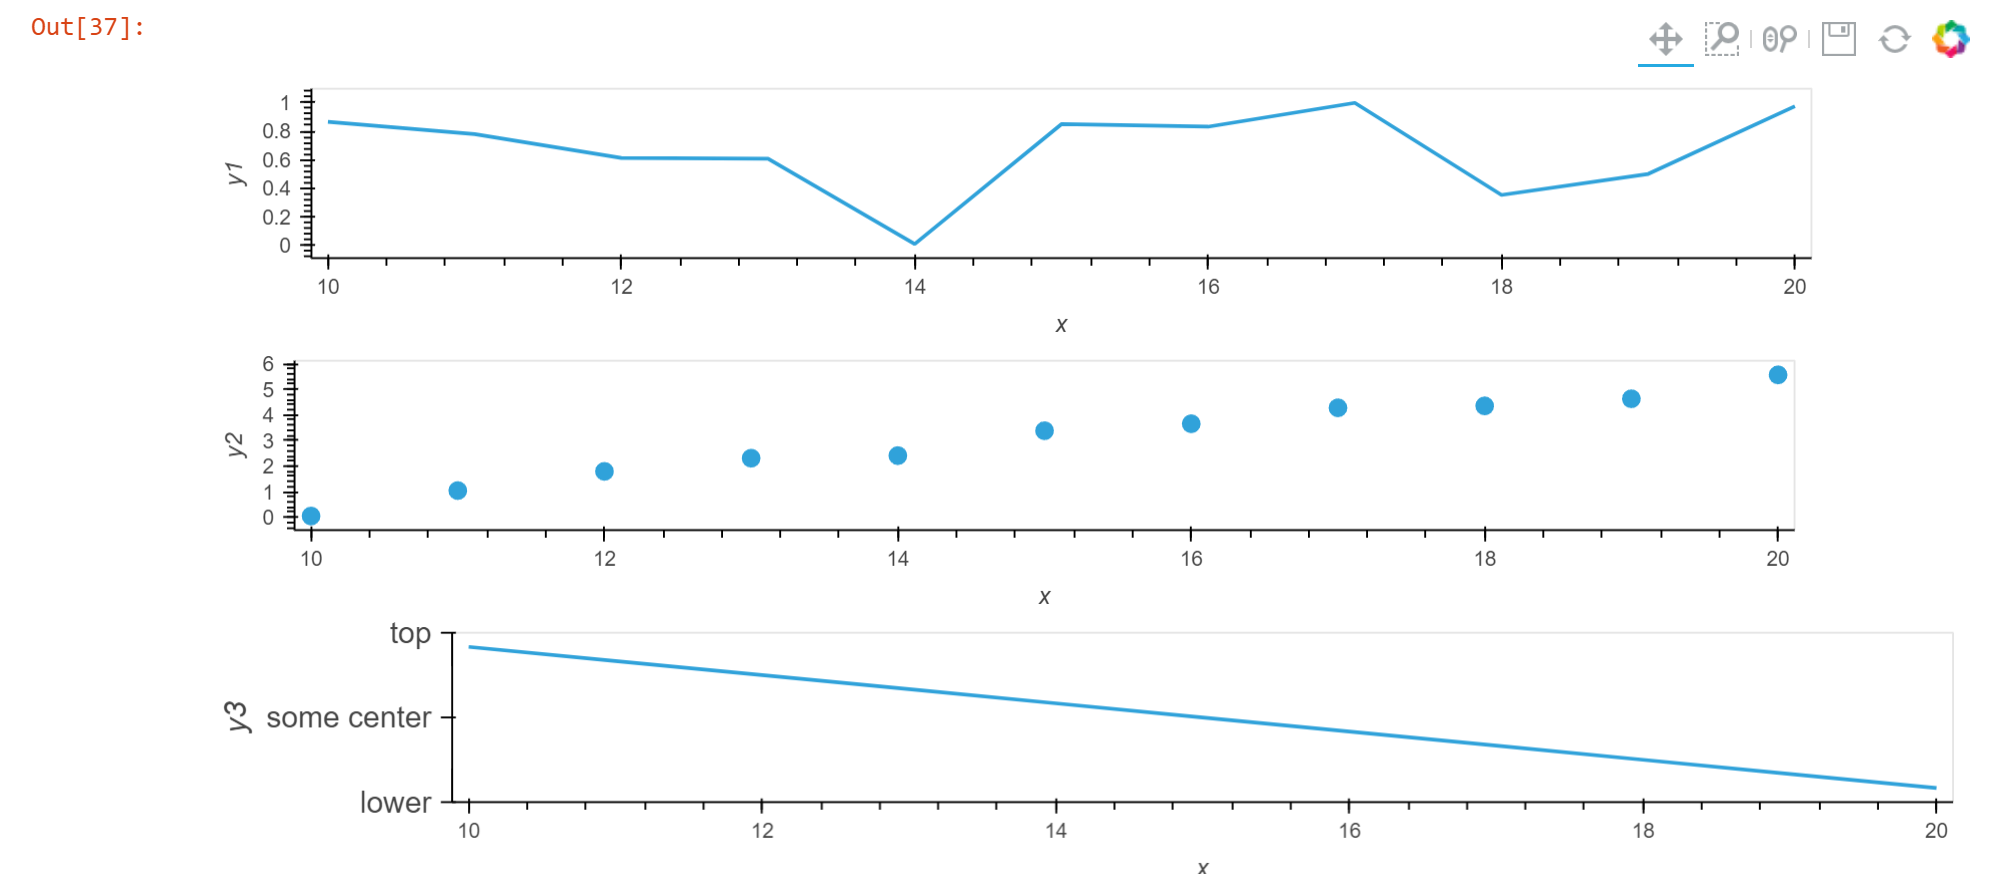
Question is if there is any way to say something like frame_align=‘left’ (or ‘top’, ‘bottom’, ‘right’)
For the plot above a possible solution is to put yaxis to the right and then the left of the plots will typically align, but maybe there is some other better way?