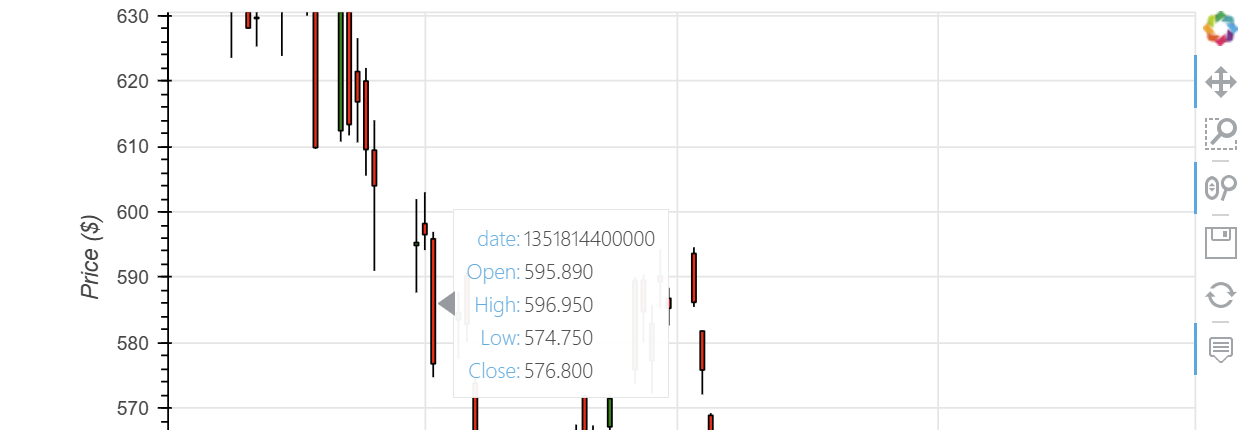
Hi, I am new to hvPlot and in official page ohlc, it seems that all date in ohlc plot represent by timestamp, which is human-unfriendly.
By the way, in step plot, date time is showed ordinarily.
So, is there any way to show date time instead of timestamp on oholc plot?
Best thanks for your answers.
carl
2
Hi @AHammerLine,
Maybe this page can help, has some different ways of setting the date time ticker
https://hvplot.holoviz.org/user_guide/Timeseries_Data.html
Thanks, Carl.
This can be done by using HoverTool and datetime formatter.
from bokeh.models import DatetimeTickFormatter, HoverTool
tooltips = [
    ('Date', '@date{%F}'),
    ('High', '@{high}{0,0.0000}'),
    ('Open', '@{open}{0,0.0000}'),
    ('Close', '@{close}{0,0.0000}'),
    ('Low', '@{low}{0,0.0000}'),
]
hover = HoverTool(tooltips=tooltips, formatters={"@date": "datetime"})
chart = (data.hvplot.ohlc(x='date', y=['open', 'low', 'high', 'close'], grid=True, tools=[hover]))
    .opts(xformatter=DatetimeTickFormatter(days='%Y-%m-%d'), xrotation=90)
What is interesting, if you do it in .opts(tools=[hover]) it will not work.
More about formatting options you can find in the doc