I have a menu in panel where users can select a variable from a dropdown menu, and then reload the the map by clicking the “load map button”. This function that I have set up works well except for this instance. ds_1 has a time dimension that can be moved through and when plotted on it’s own, works perfectly. ds_2 does not have any time dimension. When ds_1 is selected in the dropdown menu and the reload map button is clicked, the option to cycle through times appears, this option is not available for ds_2 obviously. However when a user is on ds_2 and then re loads ds_1, the option to move through the time dimension in geoviews disappears. I am not 100% sure if this is a gv or pn issue.
MRE:
import pandas as pd
import geoviews as gv
import panel as pn

gv.extension('bokeh', 'matplotlib')

data_1 = {
    'Station': ['06C', '0R0', '10G'],
    'Time': ['2023-02-18 18:00:00+00:00', '2023-02-18 19:00:00+00:00', '2023-02-18 20:00:00+00:00'],
    'Lat': [41.9893, 31.2970, 40.5372],
    'Lon': [-88.1012, -89.8128, -81.9544],
    '1 Hour Precipitation': [0.14, 0.13, 0.06]
}

df_1 = pd.DataFrame(data_1)
ds_1 = gv.Dataset(df_1, kdims=['Lon','Lat','Time'],vdims=['Station','1 Hour Precipitation'])
ds_1_pts = ds_1.to(gv.Points, ['Lon','Lat'],['Station','1 Hour Precipitation'])

data_24 = {
    'Station': ['06C', '0R0', '10G'],
    'Lat': [41.9893, 31.2970, 40.5372],
    'Lon': [-88.1012, -89.8128, -81.9544],
    '24 Hour Precipitation': [0.64, 0.02, 0.25]
}

df_24 = pd.DataFrame(data_24)
ds_24 = gv.Dataset(df_24, kdims=['Lon','Lat'],vdims=['Station','24 Hour Precipitation'])
ds_24_pts = ds_24.to(gv.Points, ['Lon','Lat'],['Station','24 Hour Precipitation'])


dropdown1 = pn.widgets.Select(name='Real Time Data', options=['1hr Precipitation','24hr Precipitation'])

load_map_button = pn.widgets.Button(name='Readload Map', button_type='primary')

@pn.depends(load_map_button.param.clicks)
def update_map(clicks):
    if clicks:
        if dropdown1.value == '1hr Precipitation':
            return (ds_1_pts)
        if dropdown1.value == '24hr Precipitation':
            return (ds_24_pts)

#creating the menu and app
menu = pn.Column(dropdown1, load_map_button)

app2 = pn.Row(menu, update_map)

app2
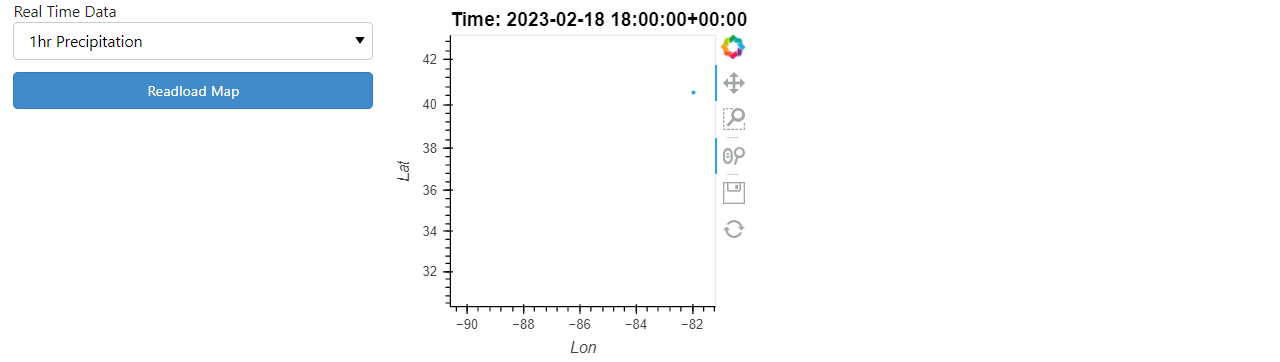
When the function is initially loaded, for 1 hour precipitation the time dimension is interactive:
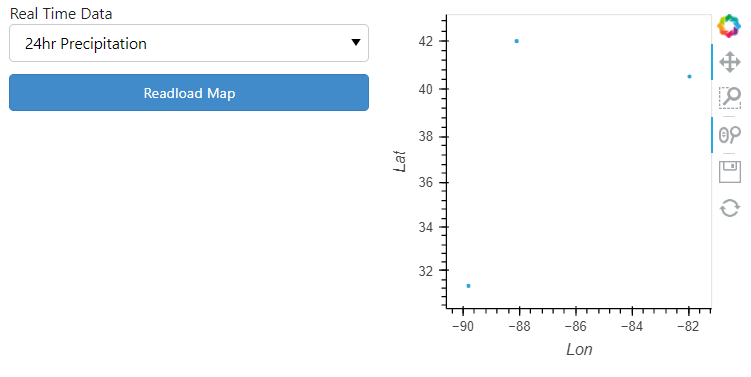
When we move to 24 hour precipitation, there is no interactive time because there is no time dimension available:
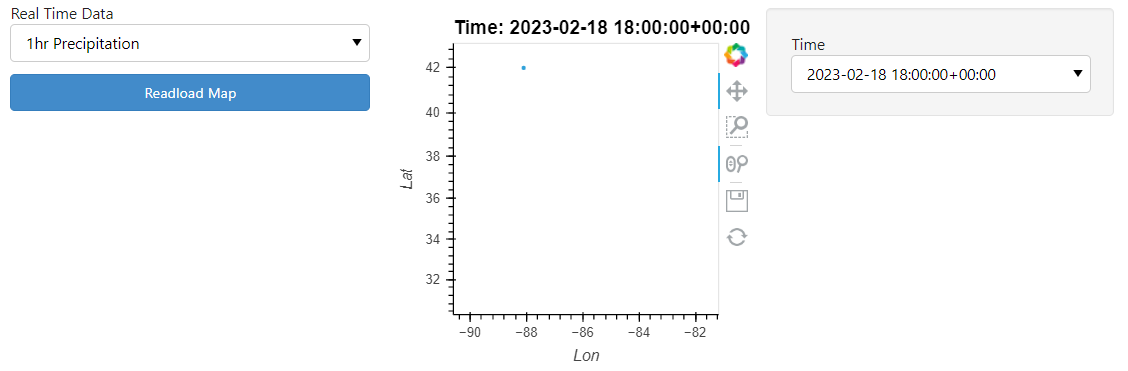
Then, when moving back to 1 hour precipitation, the interactive time widgit is now gone: