Issue with empty plot (pn.pane.plotly()) Vs. None

Hello Everyone,

Context:

I have been working on building a dashboard using FastListTemplate, where in I have inputs, button in sidebar and tabs in the main area with plots under each tabs to be displayed to the users based on the inputs selected.

Background:

To get to understanding my problem I am doing the following:

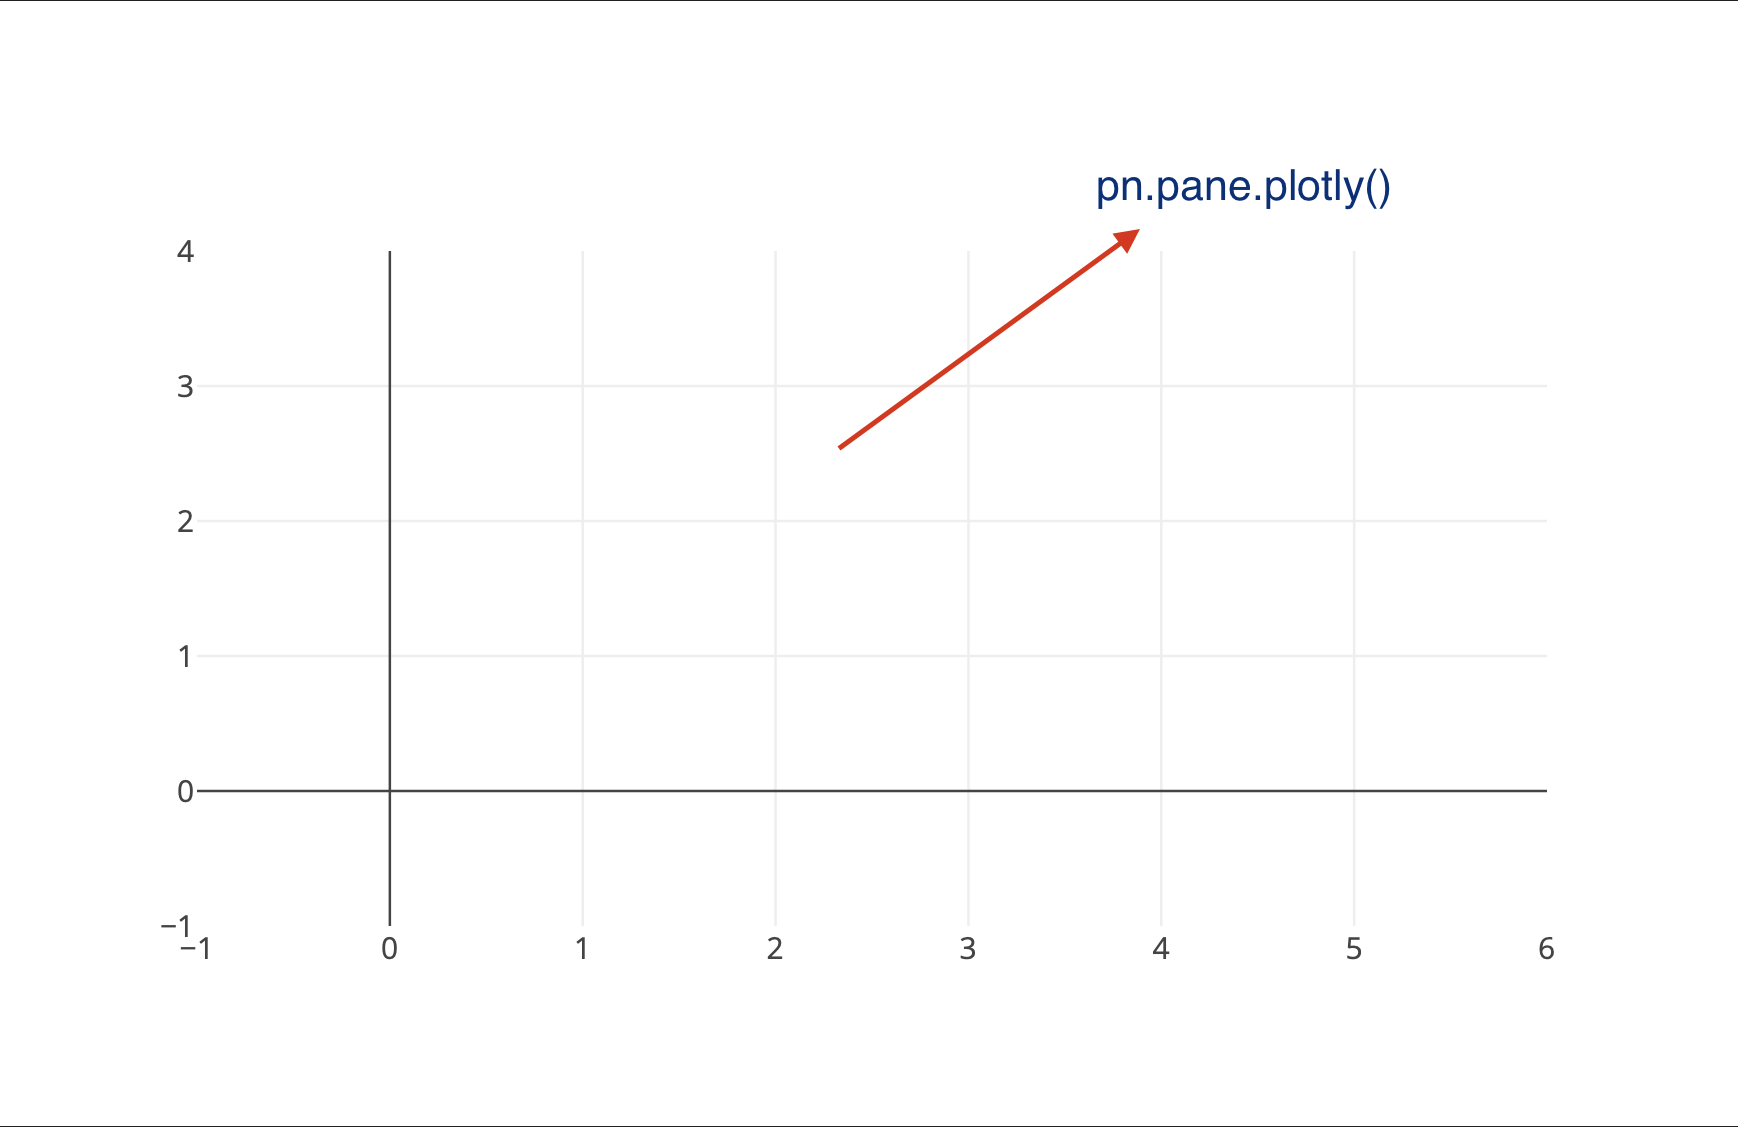
A: Initialize with empty plot

obj_plot = pn.pane.Plotly()

B: Plot generation

def distribution_plot(
    df,
    x_column,
    y_columns,
    color_names,
    title,
    xaxis_title,
    yaxis_title,
    text_format=".0f",
):
    df[x_column] = df[x_column].apply(format_bin)
    fig = go.Figure()

    for i in range(len(y_columns)):
        fig.add_trace(
            go.Bar(
                x=df[x_column],
                y=df[y_columns[i]],
                name=color_names[i],
                text=df[y_columns[i]],
                textposition="outside",
                marker_color=px.colors.qualitative.Plotly[i],
                textfont=dict(size=12),
            )
        )

    fig.update_traces(texttemplate=f"%{{text:{text_format}}}", textposition="outside")
    fig.update_layout(
        barmode="group",
        title=title,
        xaxis_title=xaxis_title,
        yaxis_title=yaxis_title,
        template="plotly_dark",
        width=850,
        height=500,
    )
    return fig
my_plot = def distribution_plot(....)
obj_plot.object = my_plot

C: API call - display plot

I did A + B + C and it is a success

Problem:

  1. I do not want an empty plot to start with as shown in figure1
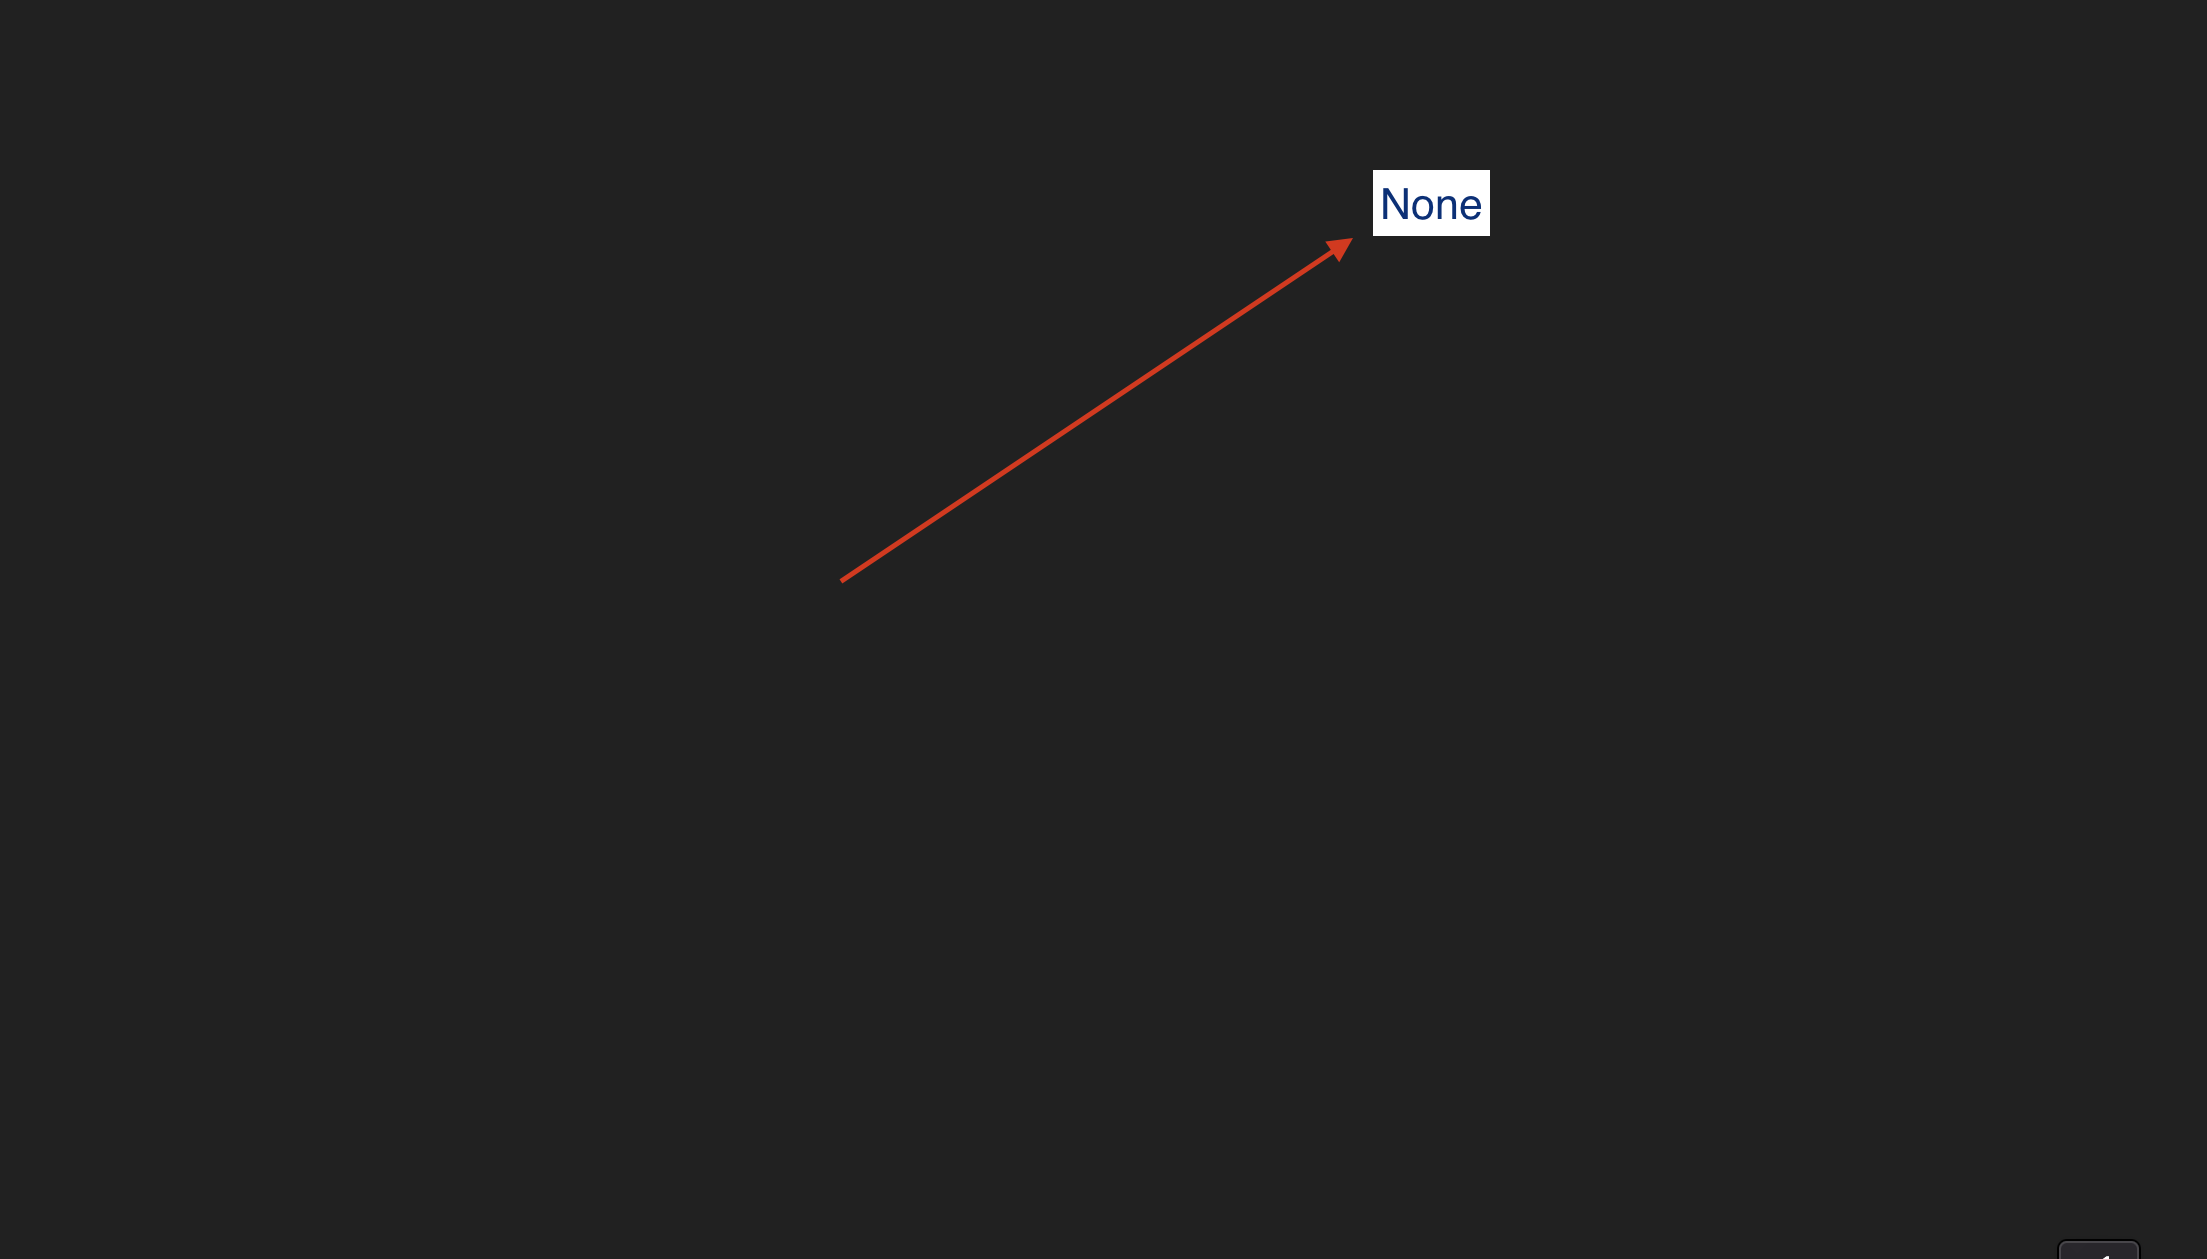
  2. I want to start off with blank to startwith as shown in figure2

so,
I did
A (obj_plot = None) + B + C and it is a Failure (plot does not get displayed upon api call)

Is there a way to start off with Blank(figure2) and be able to display the plot after the api call ?


Thanks.
p.s. I am relatively new panel user.

Hi @venv,

It’s best to post a minimal example users can paste into their system and run to be able to help. That said the idea is to create for example a pn.column then you can append and remove your graphs to this but the column must be generated on load as I understand

Maybe something like this will help

import panel as pn
import numpy as np
import holoviews as hv

pn.extension(sizing_mode = 'stretch_width')

button_append = pn.widgets.Button(name='Append', button_type='primary')
button_pop = pn.widgets.Button(name='Pop', button_type='danger')

def button_append_graph(event):
    if (len(column))>=0:
        column.append(hv.Scatter([]))
    
button_append.on_click(button_append_graph)

def button_pop_graph(non):
    if len(column)>1:
        column.pop(1) #remove 1 plot
    
button_pop.on_click(button_pop_graph)

column = pn.Column('graph will append here', sizing_mode="stretch_width", height=1000)
pn.Row(pn.Column(button_append,button_pop), column, sizing_mode="stretch_width", height=100)
2 Likes

There are many ways additional to achieve this.

Plot function that depends on data

import panel as pn
import plotly.express as px


pn.extension("plotly", sizing_mode="stretch_width")

# Used to hold the data from the api
data = pn.widgets.DataFrame()

call_api_button = pn.widgets.Button(name="Call the Api")

@pn.depends(call_api_button, watch=True)
def call_api(_):
    data.value = px.data.gapminder().query("country == 'Canada'")

@pn.depends(value=data)
def plot(value):
    if value is None:
        return "No data loaded. Call the Api"
    else:
        return px.bar(value, x='year', y='pop')
    
pn.Column(
    call_api_button, plot,
).servable()

plot-func-that-depends

Visibility of Plotly pane depends on its object

import panel as pn
import plotly.express as px


pn.extension("plotly", sizing_mode="stretch_width")

plotly_pane = pn.pane.Plotly(visible=False)
call_api_button = pn.widgets.Button(name="Call the Api")

@pn.depends(call_api_button, watch=True)
def call_api(_):
    data = px.data.gapminder().query("country == 'Canada'")
    plot = px.bar(data, x='year', y='pop')
    plotly_pane.object = plot

@pn.depends(value=plotly_pane.param.object, watch=True)
def plot(value):
    if value is None:
        plotly_pane.visible=False
    else:
        plotly_pane.visible=True
    
pn.Column(
    call_api_button, plotly_pane,
).servable()

depends-on-plotly-object

2 Likes

Thanks @Marc for showing me with the example.

1 Like

Thanks @carl for the code and I noted your suggestion as well.

1 Like