I am plotting multiple different pandas dataframe datasets in geoviews. One dataset I want a different marker shape, two of them I want with different color outlines and one remains plotted as is.
When I plot each of these separately the plots work fine, however, when all plotted together, things get weird. In my example I use a minimal dataset so that anyone could reproduce but the errors are much larger when I am using my larger dataset with a few hundred points.
I have time as a dimension that goes back about 24 hours and a slider is automatically added to the plot, when iterating over that slider everything is good for about 2-3 hours. However as I progress, certain points become the wrong color, entire datasets are not able to be hovered over, sometimes the points that are supposed to be circles become squares, and points that aren’t supposed to have outlines get outlines. The background map also disappears sometimes.
In going through the example I gave, the only aforementioned issue is that only one of the dots is hoverable, the other issues don’t seem to pop up on my end. So maybe it’s a size of data issue? Again, if you need me to provide the full .CSV files with a working example I would be happy to do so.
from datetime import datetime
import pandas as pd
import geoviews as gv

gv.extension('bokeh', 'matplotlib')

MPING_data = [  [-124.375755, 47.956669, 'Rain/Snow', '#169c2f', '2023-02-06 14:00:00+00:00'],
  [-111.917605, 41.111007, 'Rain/Snow', '#1f48cf', '2023-02-06 15:00:00+00:00'],
  [-106.707462, 44.357188, 'Rain/Snow', '#1f48cf', '2023-02-06 16:00:00+00:00'],
  [-96.782831, 43.522773, 'Rain/Snow', '#169c2f', '2023-02-06 17:00:00+00:00'],
  [-96.440108, 45.298713, 'Rain/Snow', '#ac6cd9', '2023-02-06 18:00:00+00:00']
]

MPING_data_test = pd.DataFrame(MPING_data, columns=['Lon', 'Lat', 'Current WX', 'color', 'Time'])
MPING_data_test['Time'] = pd.to_datetime(MPING_data_test['Time'])

ASOS_ptype_data =[['ORER',  36.1500, 44.0000, 'Rain', '#169c2f', '2023-02-06 14:00:00+00:00'],
['PAHY',  55.2061, -132.8281, 'Rain',  '#169c2f', '2023-02-06 15:00:00+00:00'],
['CYPX',  60.0506, -77.2869, 'Snow and/or Graupel', '#1f48cf', '2023-02-06 16:00:00+00:00'],
['PAVA',  61.5408, -165.6009, 'Snow and/or Graupel',  '#1f48cf', '2023-02-06 17:00:00+00:00'],
['MZBZ',  17.5391, -88.3082, 'Rain',  '#169c2f', '2023-02-06 18:00:00+00:00']]
ASOS_ptype_test = pd.DataFrame(ASOS_ptype_data, columns=['Station',  'Lat', 'Lon', 'Current WX',  'color', 'Time'])
ASOS_ptype_test['Time'] = pd.to_datetime(ASOS_ptype_test['Time'])

ASOS_ts_data =[
    ['HRYR',  -1.965, 30.1328, 'Rain with Thunderstorm',  '#169c2f', '2023-02-06 14:00:00+00:00'],
    ['WAHS',  -6.9708, 110.3739, 'Rain with Thunderstorm',  '#169c2f', '2023-02-06 15:00:00+00:00'],
    ['DXXX',  6.1656, 1.2545, 'Rain with Thunderstorm',  '#169c2f', '2023-02-06 16:00:00+00:00'],
    ['SBVH',  -12.6944, -60.0983, 'Rain with Thunderstorm',  '#169c2f', '2023-02-06 17:00:00+00:00'],
    ['ORER',  36.15, 44.0, 'Rain with Thunderstorm',  '#169c2f', '2023-02-06 18:00:00+00:00']
]
ASOS_ts_test = pd.DataFrame(ASOS_ts_data, columns=['Station',  'Lat', 'Lon', 'Current WX',  'color', 'Time'])
ASOS_ts_test['Time'] = pd.to_datetime(ASOS_ts_test['Time'])

ASOS_dataset_ptype_test = gv.Dataset(ASOS_ptype_test, kdims=['Lon','Lat','Time'],vdims=['Current WX','color'])
ASOS_points_ptype_test = ASOS_dataset_ptype_test.to(gv.Points, ['Lon','Lat'],['Current WX','color'])

ASOS_dataset_ts_test = gv.Dataset(ASOS_ts_test, kdims=['Lon','Lat','Time'],vdims=['Current WX','color'])
ASOS_points_ts_test = ASOS_dataset_ts_test.to(gv.Points, ['Lon','Lat'],['Current WX','color'])

MPING_dataset_ptype_test = gv.Dataset(MPING_data_test, kdims=['Lon','Lat','Time'],vdims=['Current WX','color'])
MPING_points_ptype_test = MPING_dataset_ptype_test.to(gv.Points, ['Lon','Lat'],['Current WX','color'])

(gv.tile_sources.OSM() * MPING_points_ptype_test.opts(opts.Points(marker='square')) *ASOS_points_ts_test.opts(opts.Points(line_color='red'))*ASOS_points_ptype_test).opts(opts.Points(color='color',tools=['hover']))
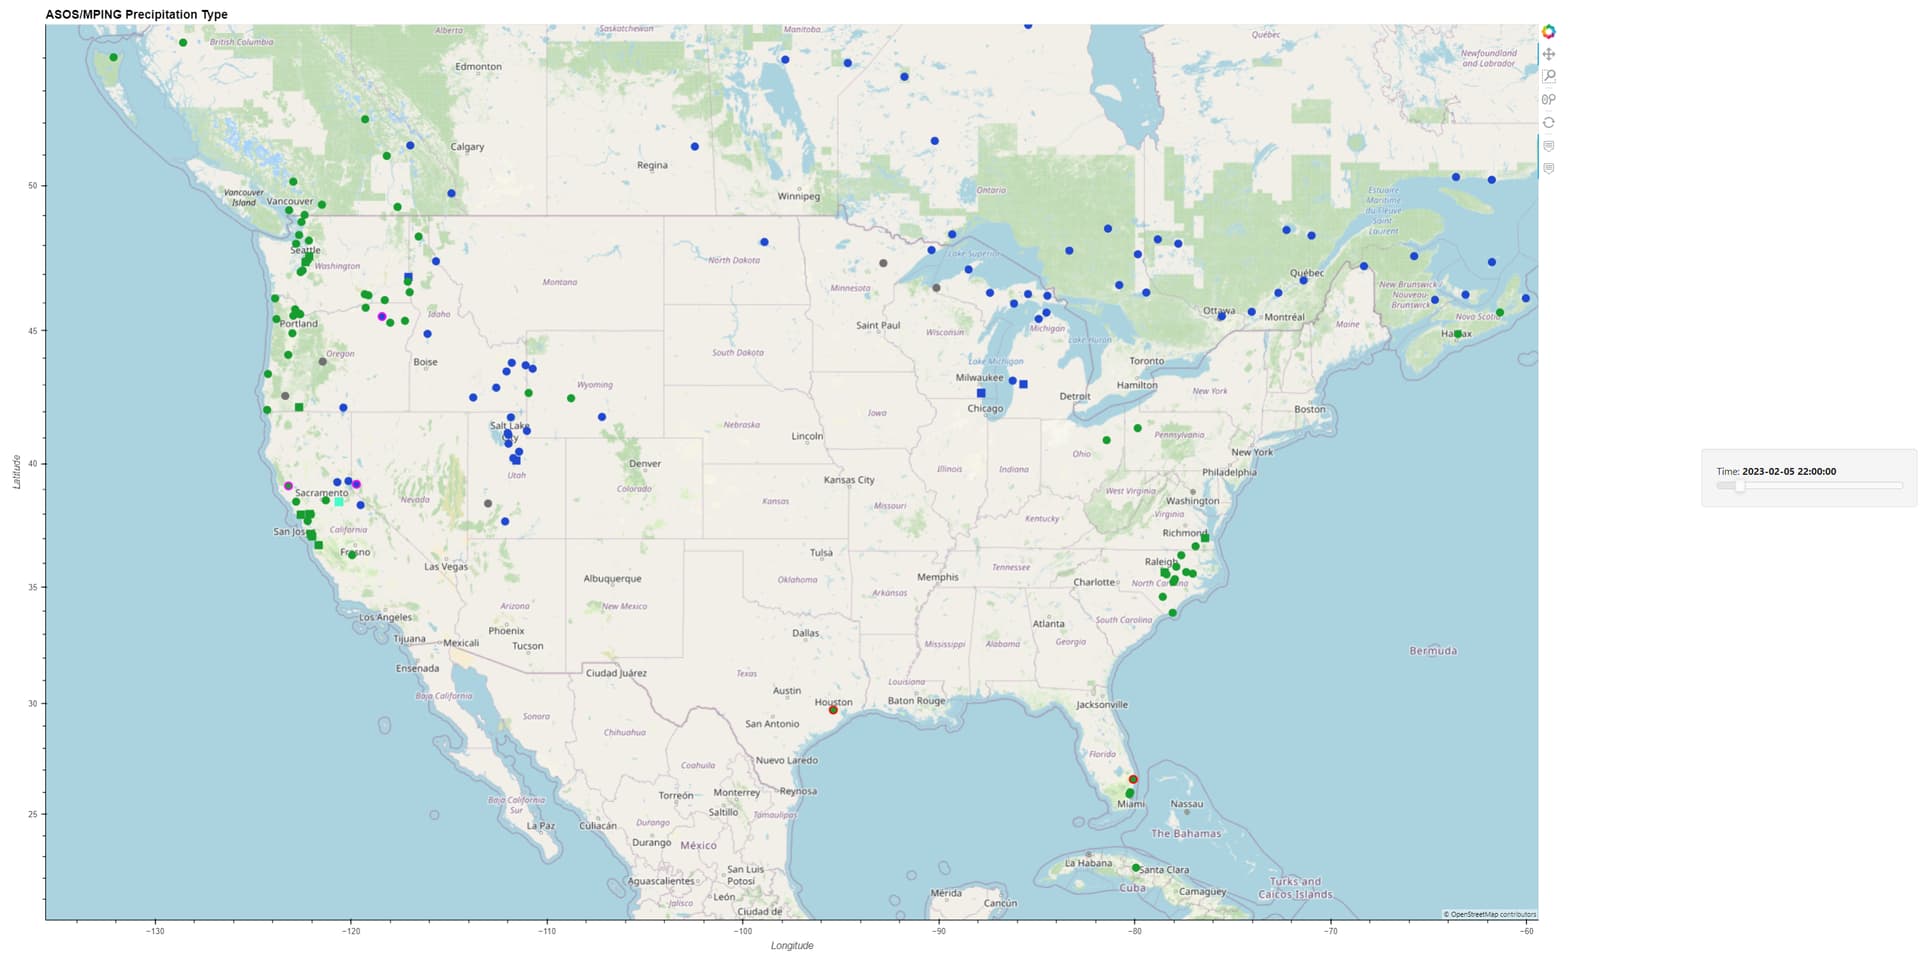
Here is a good example of what I am talking about, the data looks normal when plotted here, besides the fact that only certain pointer are hoverable
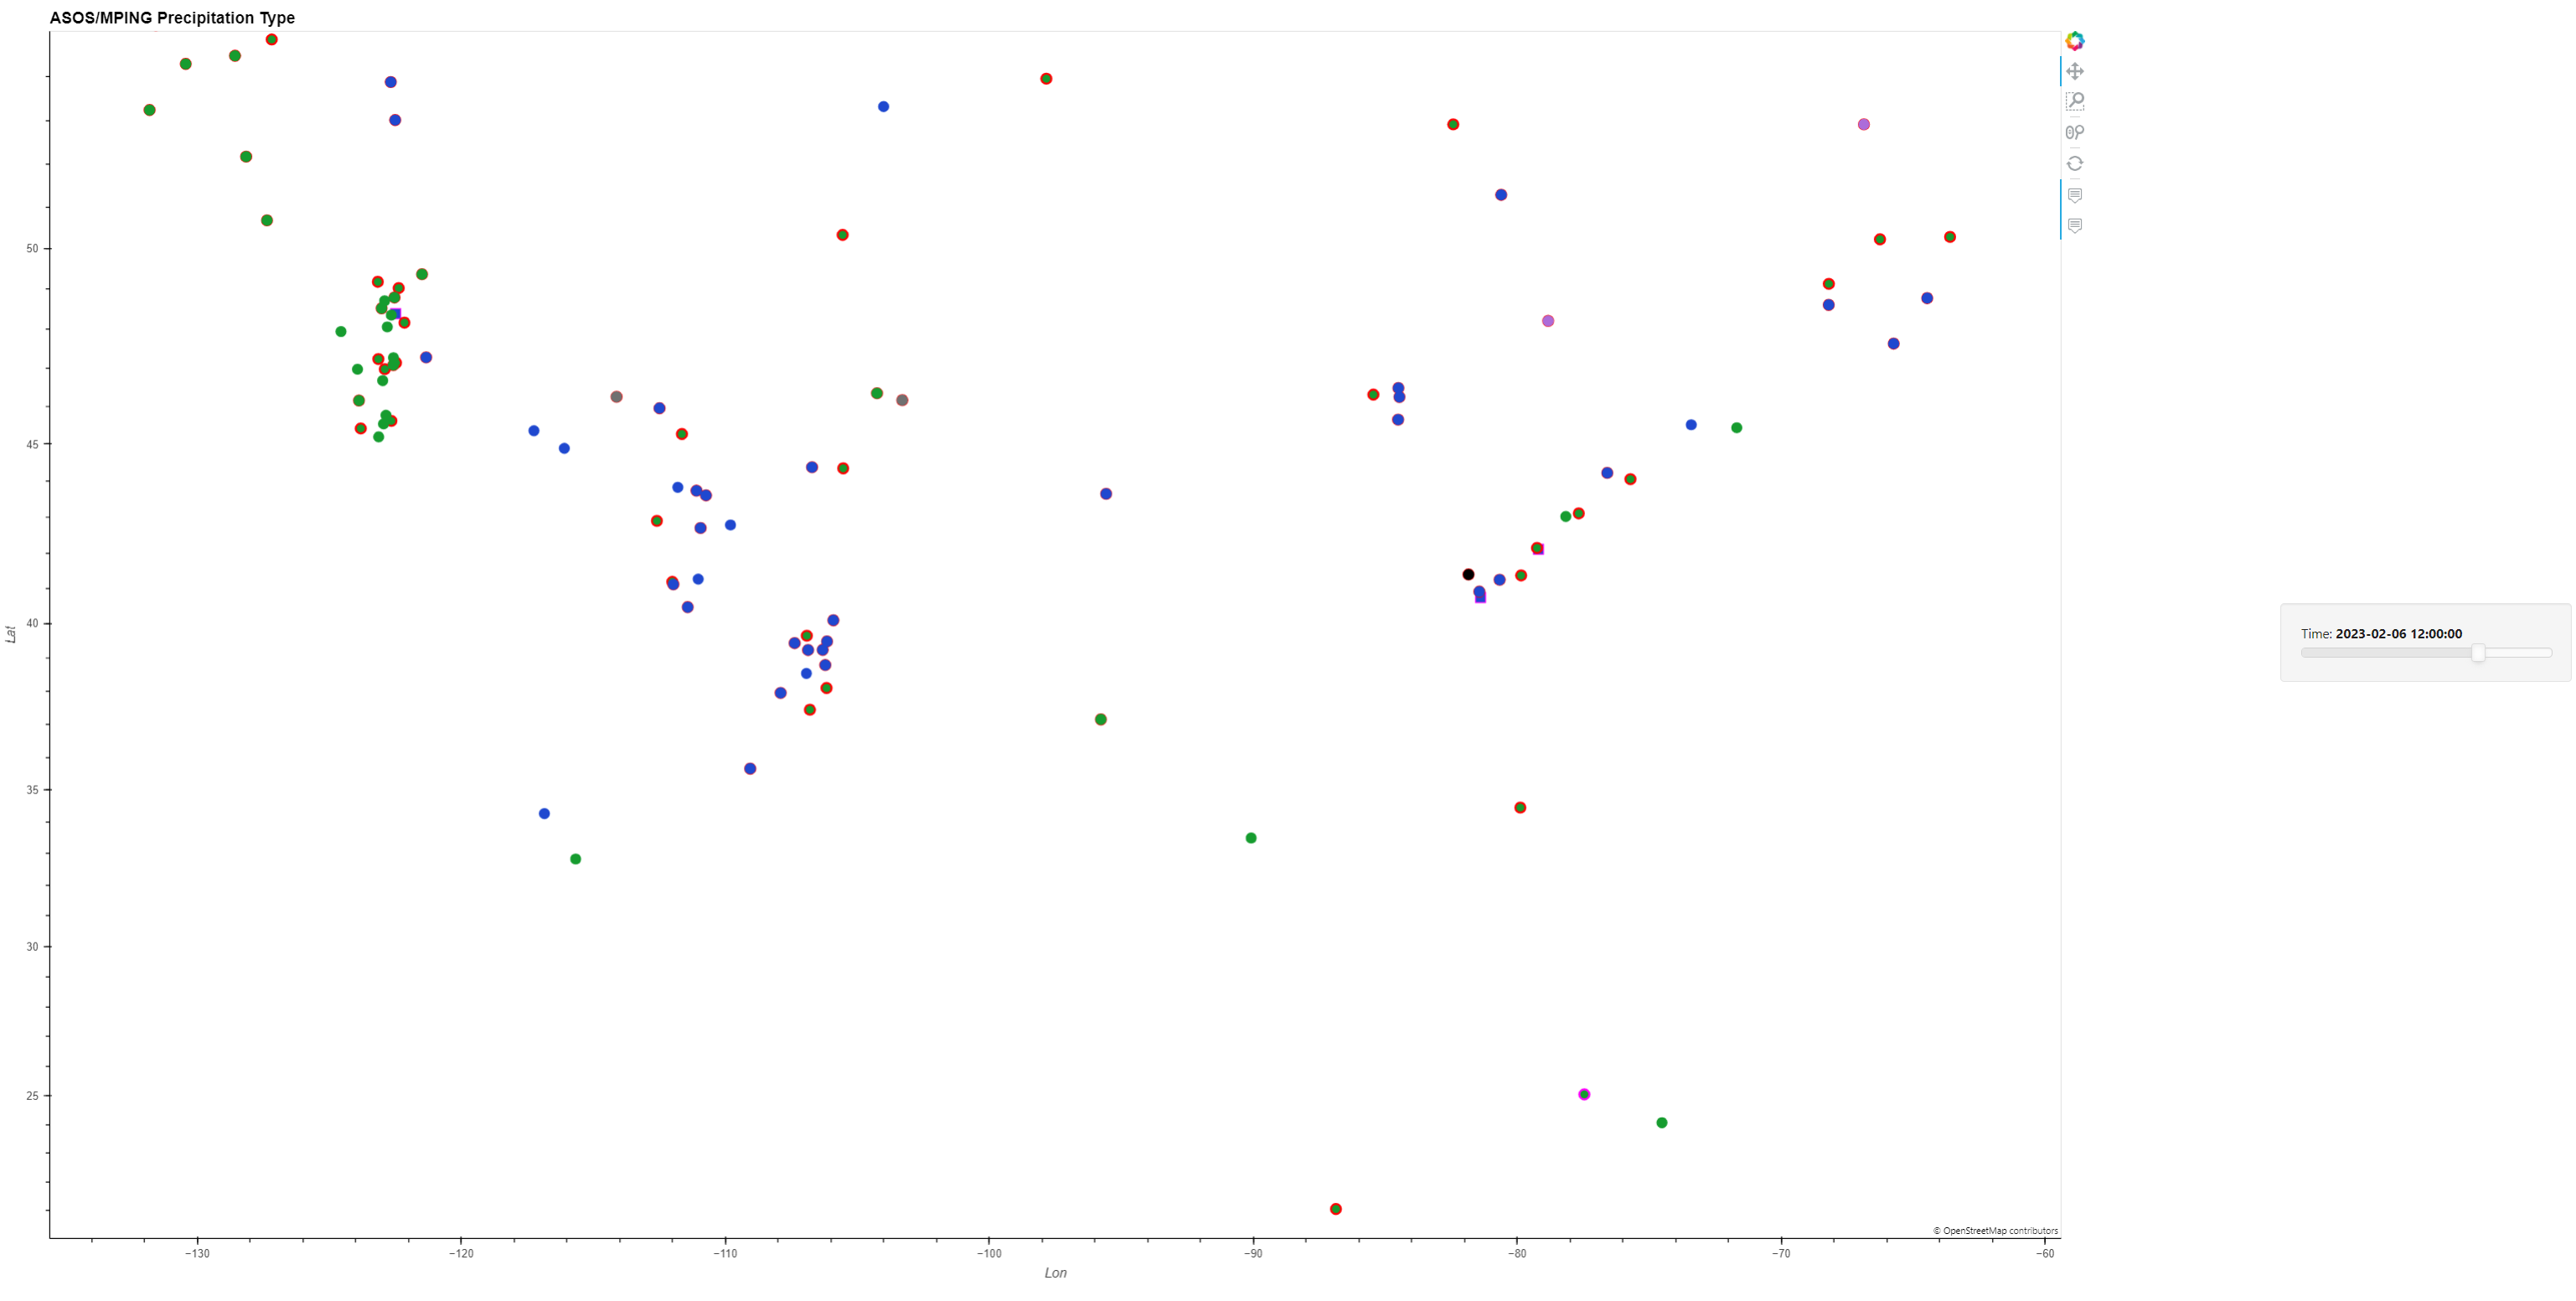
But when Traversing through the dataset, most of the points are now the wrong color/shape/ have the wrong outline color, and the background map has disappeared.