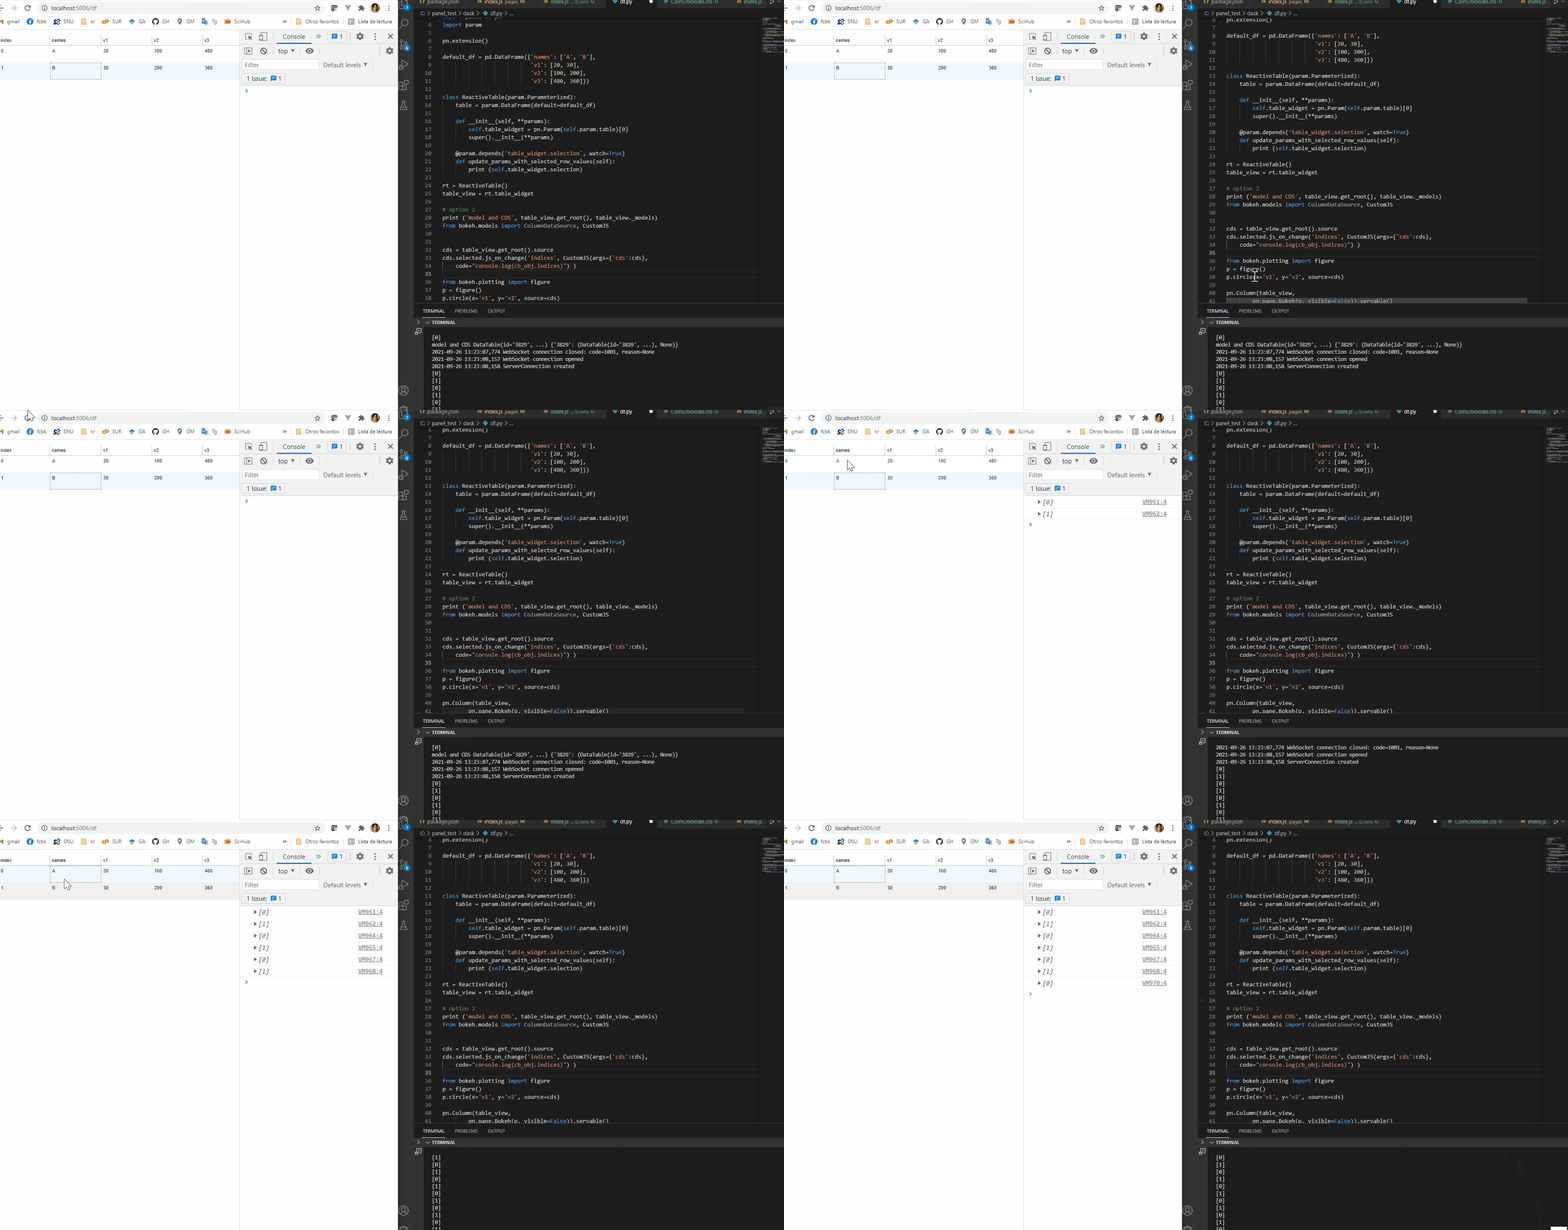
Hello, I was wondering if there is a way to jslink or jscallback selection parameter from a DataFrame widget?
I do not know why these options do not work. I guess I am getting the wrong Column Data Source
import pandas as pd
import panel as pn
import param
pn.extension()

default_df = pd.DataFrame({'names': ['A', 'B'], 'v1': [20, 30],
                           'v2': [100, 200],     'v3': [480, 360]})

class ReactiveTable(param.Parameterized):
    table = param.DataFrame(default=default_df)

    def __init__(self, **params):
        self.table_widget = pn.Param(self.param.table)[0]
        super().__init__(**params)

    @param.depends('table_widget.selection', watch=True)
    def update_params_with_selected_row_values(self):
        print (self.table_widget.selection)

rt = ReactiveTable()
table_view = rt.table_widget

# option 1
# rt.table_widget.jscallback(**{'selection': "console.log('selecting')"})

# option 2
print ('model and CDS', table_view._get_model(doc=pn.state.curdoc).source)
from bokeh.models import ColumnDataSource, CustomJS
cds = table_view._get_model(doc=pn.state.curdoc).source
cds.selected.js_on_change('indices', CustomJS(args={'cds':cds}, code="console.log('selecting 2')") )

#option 3
#print ('model and CDS', table_view.get_root())
#cds = table_view.get_root().source
#cds.selected.js_on_change('indices', CustomJS(args={'cds':cds}, #code="console.log('aa')") )

#%% option 4
#cds.selected.js_on_event('indices', CustomJS(args={'cds':cds}, code="console.log('aa', cb_obj)") )

table_view.servable()
I think it is related to this opened bug. The cds is not appended to the document, then the callbacks are not firing
This works, but it is really ugly. As suggested in the github issue, adding an invisible plot to the document, it adds the cds to the doc, then the js callback works

import pandas as pd
import panel as pn
import param

pn.extension()

default_df = pd.DataFrame({'names': ['A', 'B'],
                           'v1': [20, 30],
                           'v2': [100, 200],
                           'v3': [480, 360]})

class ReactiveTable(param.Parameterized):
    table = param.DataFrame(default=default_df)

    def __init__(self, **params):
        self.table_widget = pn.Param(self.param.table)[0]
        super().__init__(**params)

    @param.depends('table_widget.selection', watch=True)
    def update_params_with_selected_row_values(self):
        print (self.table_widget.selection)

rt = ReactiveTable()
table_view = rt.table_widget

# option 2
print ('model and CDS', table_view.get_root(), table_view._models)
from bokeh.models import ColumnDataSource, CustomJS


cds = table_view.get_root().source
cds.selected.js_on_change('indices', CustomJS(args={'cds':cds},
    code="console.log(cb_obj.indices)") )

from bokeh.plotting import figure
p = figure()
p.circle(x='v1', y='v2', source=cds)

pn.Column(table_view,
        pn.pane.Bokeh(p, visible=False)).servable()