Trying to run this locally. Used to work for me, but now output cell in Jupyter lab doesn’t accommodate output. Unfortunately I didn’t keep track of which versions of various packages for which this worked.
import panel as pn
import pandas as pd
import altair as alt
from bokeh.sampledata import stocks
pn.extension('vega')
title = '## Stock Explorer Altair'
tickers = ['AAPL', 'FB', 'GOOG', 'IBM', 'MSFT']
def get_df(ticker, window_size):
df = pd.DataFrame(getattr(stocks, ticker))
df['date'] = pd.to_datetime(df.date)
return df.set_index('date').rolling(window=window_size).mean().reset_index()
def get_plot(ticker, window_size):
df = get_df(ticker, window_size)
return alt.Chart(df).mark_line().encode(x='date', y='close')
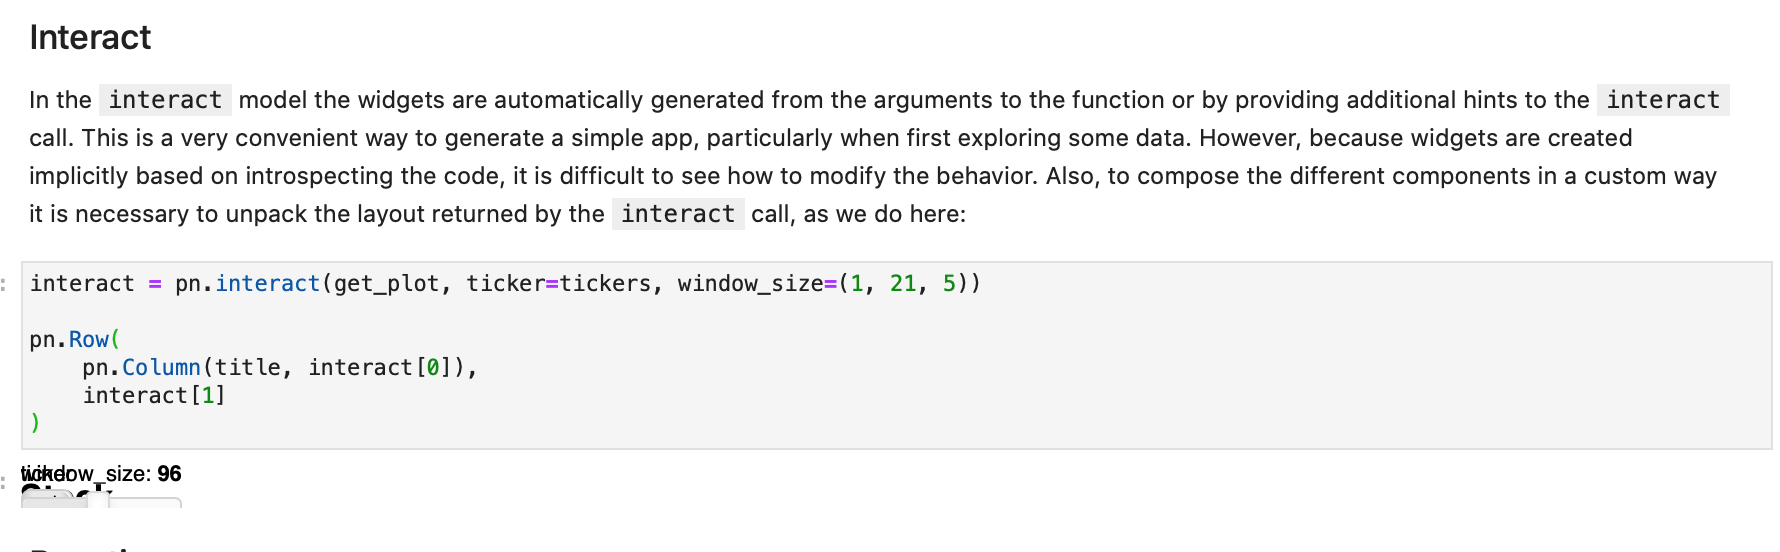
interact = pn.interact(get_plot, ticker=tickers, window_size=(1, 21, 5))
pn.Row(
pn.Column(title, interact[0]),
interact[1]
)
python 3.8.0
Mac OS

Package           Version
----------------- ---------
altair            4.0.1
bokeh             2.0.0
jupyterlab        2.0.1
pandas            1.0.3
panel             0.9.3
vega-datasets     0.8.0

Known labextensions:
   app dir: /Users/Brent/python_env/env1/share/jupyter/lab
        @pyviz/jupyterlab_pyviz v1.0.0  enabled  OK