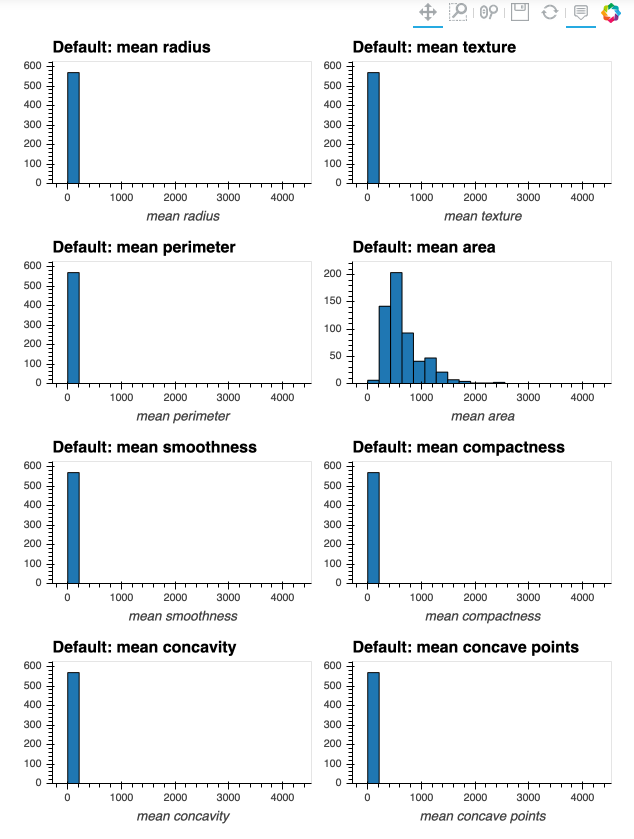
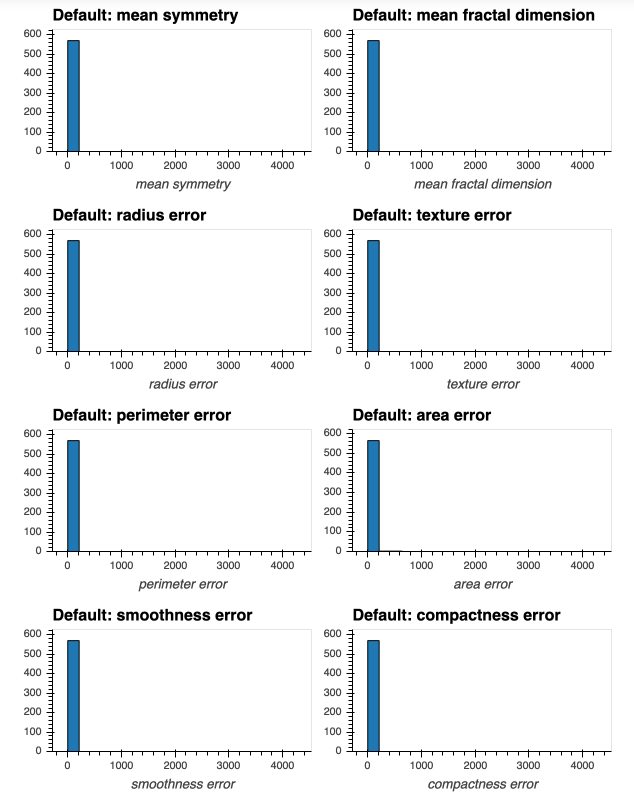
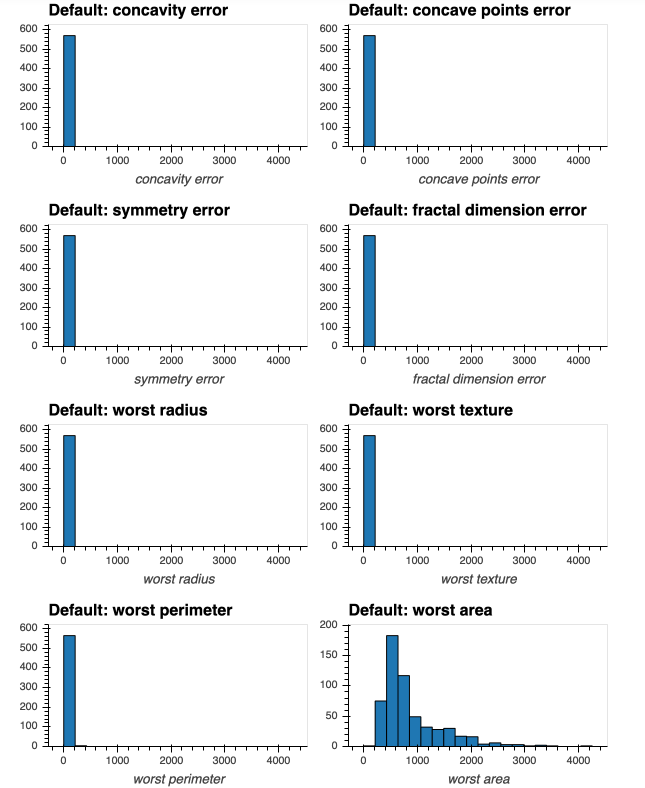
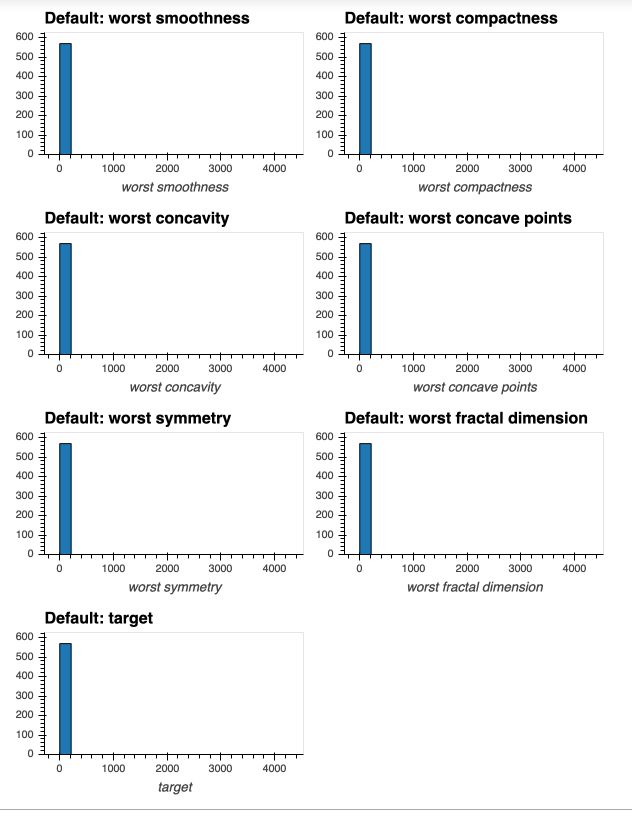
I can successfully produce the following subplot of histograms:
In [4]: # THIS WILL PRODUCE HISTOGRAMS FOR ALL NUMERIC ATTRIBUTES IN DATAFRAME df, INCLUDING OUR "target" COLUMN:
   ...: df.hvplot.hist(width=300, height=200,
   ...:                subplots=True,
   ...:                shared_axes=False
   ...:               ).cols(2)
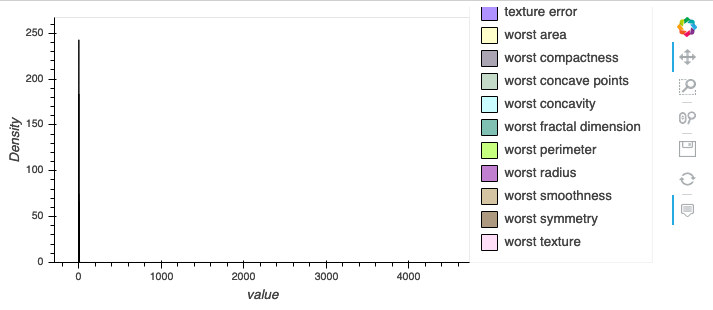
However, when I try to produce a subplot of KDE plots, then subplots = True does not appear to work:
In [11]: df.hvplot.kde(subplots=True,
    ...:               shared_axes=False
    ...:              )#.cols(2)
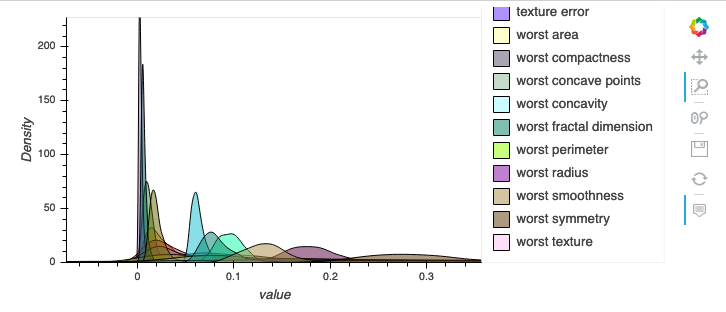
Zoomed in version to improve readability:
An additional issue I have producing this multiplot of KDEs is that inclusion of .cols(2) above throws an error that I don’t get with the histograms:
AttributeError: 'NdOverlay' object has no attribute 'cols'
Although I debated if that was caused by subplots=True not working correctly?
Does anyone have any idea what is happening here?
Thanks
Software Versions:
pandas                    1.0.3            py37h6c726b0_0
numpy                     1.18.1           py37h7241aed_0
holoviews                 1.13.1                     py_0    pyviz
hvplot                    0.5.2                      py_0    pyviz
feather-format            0.4.0                   py_1003    conda-forge
bokeh                     1.4.0                    py37_0
plotly                    4.5.4                      py_0    plotly