Hi,
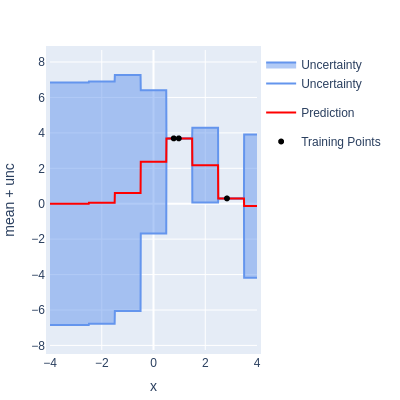
I use holoviews with backend plotly to rotate 3D plots like Surface or Scatter3D (beside this I also use Curve, Histogram etc). However, I think the power of plotly is very weak in holoviews (changing color of Surface plots is not trivial, see issue). I noticed that many features are missing in this backend compared to bokeh (or matplotlib). For example, adding a legend to an Area plot in plotly looks like this:
In bookeh it looks like this:
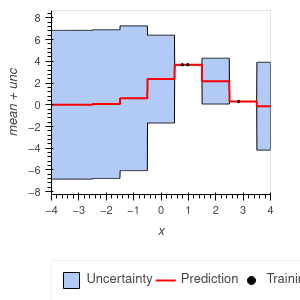
Regardless of the fact that legend_position does not exist in plotly, the Area with label Uncertainty is shown twice in the first plot. I had many such problems using backend plotly and I wonder if it is even useful to keep using it.
Can anyone help me with this ‘Area-legend’ plot? How to display Uncertainty once?
What are your experiences using plotly? Did you stop using it? Or just found a mind-blowing trick?
Thank you 
Betül
Edit: I can solve the problem of duplicate labels by applying hook. In both, plot.state['data'][0] and plot.state['data'][1] the name attribute is set to: ‘Uncertainty’. If I apply showlegend=False to the first one, my problem is solved.
def hook(plot, element):
    if plot.state['data'][0]['name'] == 'Uncertainty':
        plot.state['data'][0]['showlegend'] = False

d1.opts(hooks=[hook])
Is this a proper way for a solution?