Hi!
I’m trying to combine multiple Altair plots with variable sizes using Panel, but once they grow too large, they start overlapping.
Some example code that demonstrates this issue:
Summary
import panel as pn
import pandas as pd
import numpy as np
import altair as alt


def make_plot():
    # Example heatmap from
    # https://altair-viz.github.io/gallery/simple_heatmap.html
    # with increased width/height

    # Compute x^2 + y^2 across a 2D grid
    x, y = np.meshgrid(range(-5, 5), range(-5, 5))
    z = x**2 + y**2

    # Convert this grid to columnar data expected by Altair
    source = pd.DataFrame({'x': x.ravel(), 'y': y.ravel(), 'z': z.ravel()})

    return pn.pane.Vega(
        alt.Chart(source).\
        mark_rect().\
        encode(x='x:O', y='y:O',
                color='z:Q').\
        properties(
            height=500,
            width=500
        ))


plots = []
for i in range(5):
    plots.append(make_plot())

pn.serve(pn.Row(objects=plots))
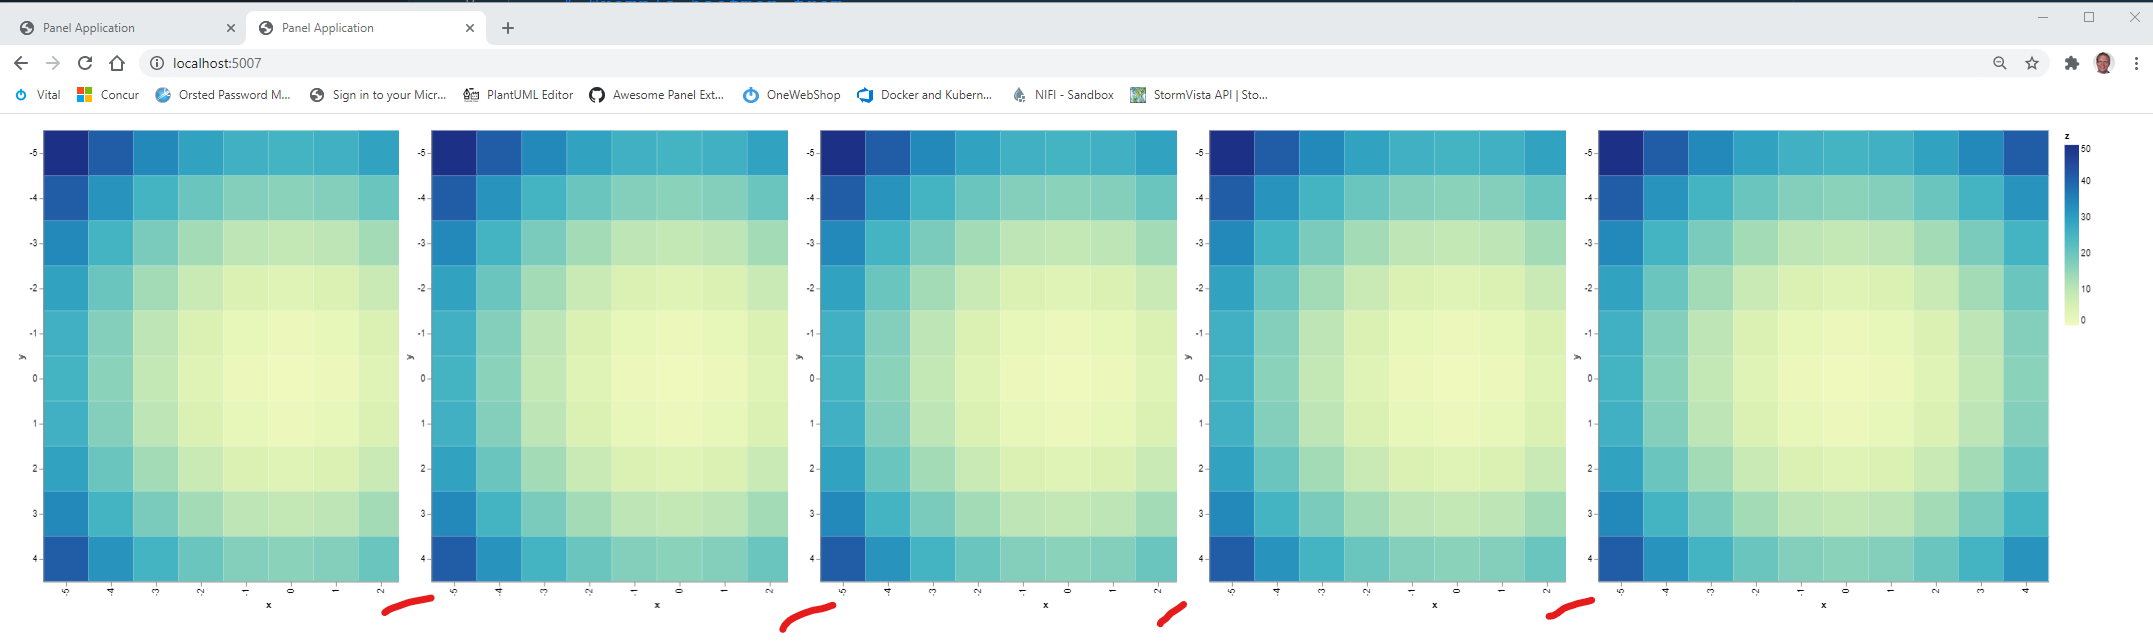
It appears as though the individual items of the row are limited to ~450 pixels in width.
The pn.pane.Vega indeed seems to have a fixed width. But setting their sizing_mode="stretch_width" fixes the problem if you have a wide enough window/ screen.
import panel as pn
import pandas as pd
import numpy as np
import altair as alt


def make_plot():
    # Example heatmap from
    # https://altair-viz.github.io/gallery/simple_heatmap.html
    # with increased width/height

    # Compute x^2 + y^2 across a 2D grid
    x, y = np.meshgrid(range(-5, 5), range(-5, 5))
    z = x**2 + y**2

    # Convert this grid to columnar data expected by Altair
    source = pd.DataFrame({'x': x.ravel(), 'y': y.ravel(), 'z': z.ravel()})

    return pn.pane.Vega(
        alt.Chart(source).\
        mark_rect().\
        encode(x='x:O', y='y:O',
                color='z:Q').\
        properties(
            height=500,
            width=500
        ), sizing_mode="stretch_width")


plots = []
for i in range(5):
    plots.append(make_plot())

pn.serve(pn.Row(objects=plots), port=5007)
An alternative to fixed width would be responsive. I think that is better. You do that by also setting width="container".
import panel as pn
import pandas as pd
import numpy as np
import altair as alt


def make_plot():
    # Example heatmap from
    # https://altair-viz.github.io/gallery/simple_heatmap.html
    # with increased width/height

    # Compute x^2 + y^2 across a 2D grid
    x, y = np.meshgrid(range(-5, 5), range(-5, 5))
    z = x**2 + y**2

    # Convert this grid to columnar data expected by Altair
    source = pd.DataFrame({'x': x.ravel(), 'y': y.ravel(), 'z': z.ravel()})

    return pn.pane.Vega(
        alt.Chart(source).\
        mark_rect().\
        encode(x='x:O', y='y:O',
                color='z:Q').\
        properties(
            height=500,
            width="container",
        ), sizing_mode="stretch_width")


plots = []
for i in range(5):
    plots.append(make_plot())

pn.serve(pn.Row(objects=plots), port=5007)