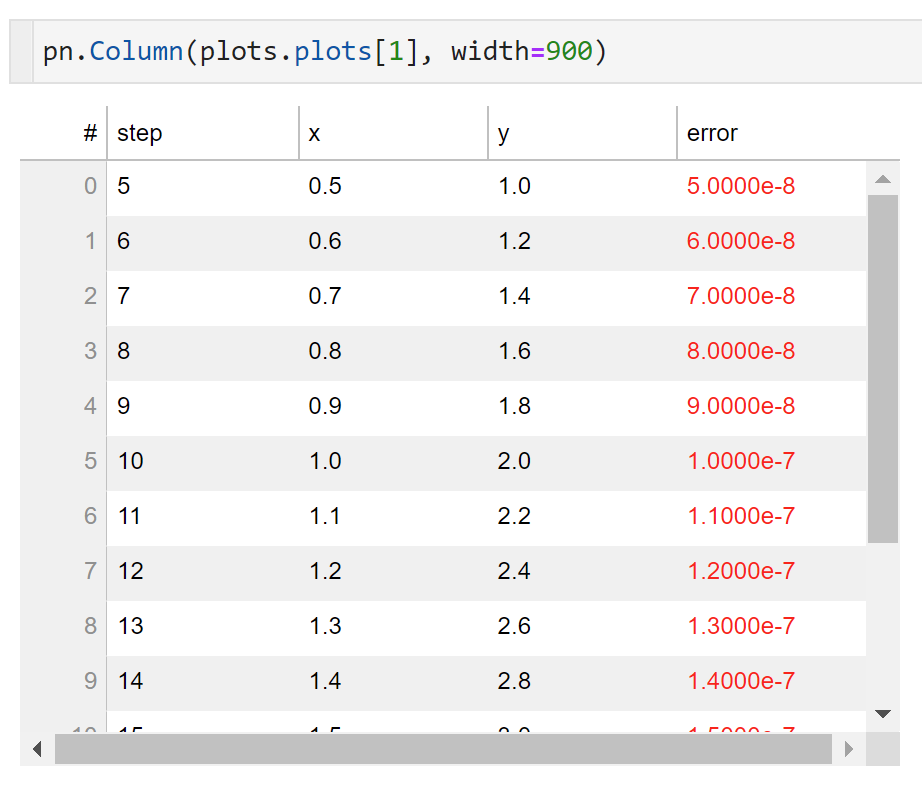
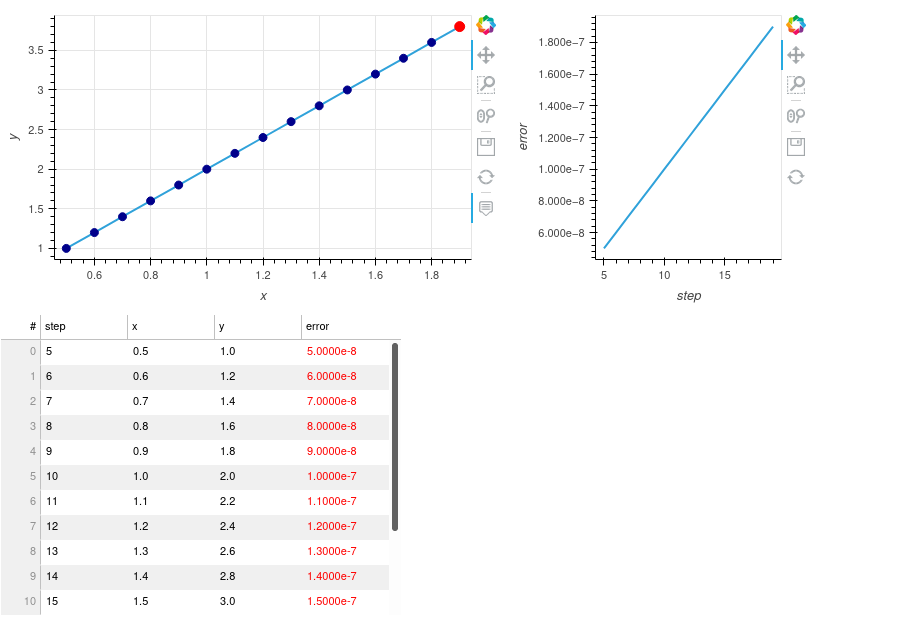
Getting really rusty: I wanted to use an hv.Buffer to update two Graphs and a table.
For the life of me, I can’t get the layout pn.Column( pn.Row( h_xy, h_err), h_tbl )
I’d appreciate help getting this to work, or a better solution?!
from IPython.core.interactiveshell import InteractiveShell
InteractiveShell.ast_node_interactivity = "all"

import time
import numpy as np
import pandas as pd

from bokeh.models.widgets import HTMLTemplateFormatter
import param
import holoviews as hv; hv.extension("bokeh", logo=False)
import panel as pn;     pn.extension()

class GraphicalMonitorA():
    """monitor the error evolution of an iterative scheme"""
    def __init__(self, sz=10,use_log=False):
        data_def     = {'step':int, 'x': float, 'y': float, 'error': float }
        data         = pd.DataFrame( {i:[] for i in data_def.keys()}, columns=data_def.keys())\
                            .astype(dtype=data_def)

        self.buffer  = hv.streams.Buffer(data, length=sz, index=False)
        self.use_log = use_log

        def monitor_data(dat):
            self.buffer .send( pd.DataFrame( [[dat[0], dat[1], dat[2], dat[3] ]],
                                             columns=data_def .keys() ).astype(dtype=data_def ))
        def plot(data):
            if data.empty:
                return ((hv.Scatter([],'x','y')*hv.Curve([],'x','y')*\
                         hv.Scatter([],'x','y')).opts(width=500,xticks=4,yticks=4,  tools=['hover'], show_grid=True,
                                                      title='Solution Estimate')+\
                         hv.Curve([],'step','error').opts(logy=self.use_log, yticks=4, show_grid=True,
                                                          title='Error') +\
                         hv.Table( data ).opts(height=450)
                       )

            h_last_point = hv.Scatter( (data['x'].iloc[-1], data['y'].iloc[-1]), 'x', 'y' ).opts( size=10,color='red')
            h_points     = hv.Curve(   (data['x'],data['y']), 'x', 'y' )*\
                           hv.Scatter( (data['x'],data['y']), 'x', 'y' ).opts(color='darkblue',padding=.05,size=8, tools=['hover'], show_grid=True)
            h_error      = hv.Curve(   (data['step'],data['error']), 'step', 'error' )
            h_tbl        = hv.Table( data )

            h            = (h_points.opts(xticks=4,yticks=4) * h_last_point).opts(width=500) +\
                           h_error.opts(padding=.05,xticks=4,logy=self.use_log) +\
                           h_tbl

            return h.cols(2)

        self.monitor  = monitor_data
        self.plot     = plot

        self.dmap     = hv.DynamicMap( self.plot,  streams=[self.buffer ])

    def reset_plots(self):
        self.buffer .clear()

plots = GraphicalMonitorA(5,use_log=False)
plots.dmap
for i in range(5):
    plots.monitor( [i, 0.1 * i, 0.2 *i, 1e-12 *i] )