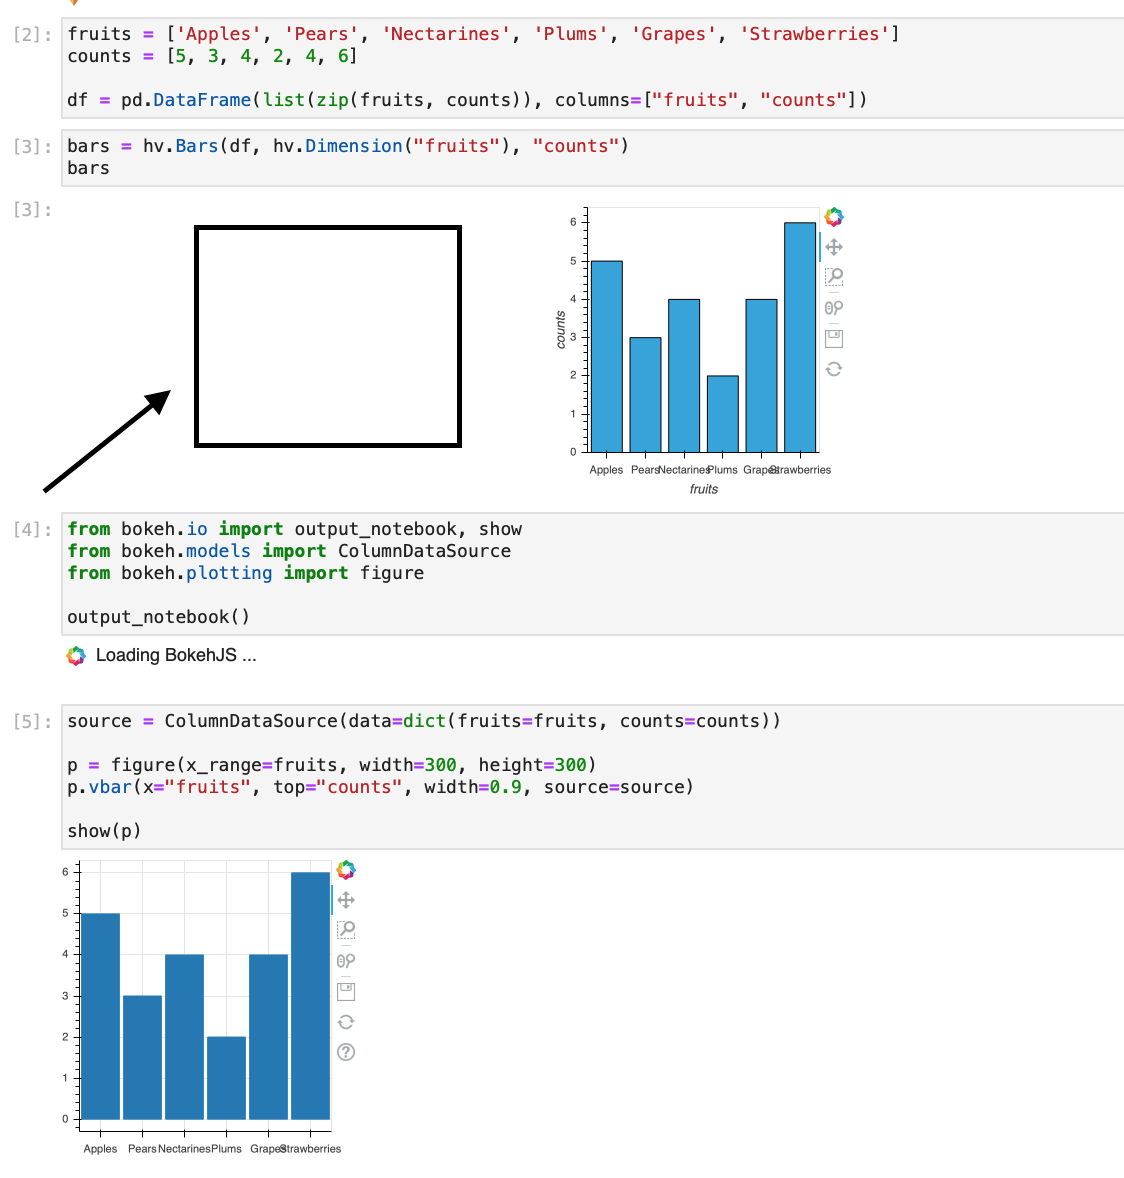
Is there a way to left-justify output in JupyterLab cells from plots made with Holoviews, as seems to be the default when using Bokeh? Perhaps this is a JuperLab setting?
import numpy as np

import holoviews as hv
import pandas as pd

hv.extension("bokeh")

fruits = ['Apples', 'Pears', 'Nectarines', 'Plums', 'Grapes', 'Strawberries']
counts = [5, 3, 4, 2, 4, 6]

df = pd.DataFrame(list(zip(fruits, counts)), columns=["fruits", "counts"])

bars = hv.Bars(df, hv.Dimension("fruits"), "counts")
bars

from bokeh.io import output_notebook, show
from bokeh.models import ColumnDataSource
from bokeh.plotting import figure

output_notebook()

source = ColumnDataSource(data=dict(fruits=fruits, counts=counts))

p = figure(x_range=fruits, width=300, height=300)
p.vbar(x="fruits", top="counts", width=0.9, source=source)

show(p)
bokeh                     2.2.3
holoviews                 1.14.1
hvplot                    0.7.0
jupyter_client            6.1.11
jupyter_core              4.7.0
jupyter_server            1.2.2
jupyterlab                3.0.5
jupyterlab_code_formatter 1.4.2
jupyterlab_pygments       0.1.2
jupyterlab_server         2.1.2
pandas                    1.2.0
panel                     0.10.3
Thank you, Brent