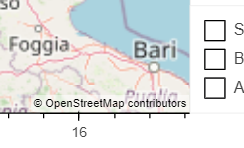
I have two polygon GeoDataFrames that I want to show on the same map plot. Both should be rendered according to a categorical column and cmap. If I try to do this, I get only one legend (for the first layer) and the colors are broken (all white):
map1 = gdf1.hvplot(geo=True, c='class1', cmap={'A': 'blue', 'B': 'green', 'S': 'red', 'none': 'gray'}, alpha=0.5, tiles='OSM')
map2 = gdf2.hvplot(geo=True, c='class2', cmap={'abc':'white', 'def':'gray'})
map1 * map2

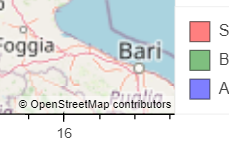
I can partially fix this by deactivating the legend for the second layer. Then the colors of the first layer legend items are displayed correctly:
map1 = gdf1.hvplot(geo=True, c='class1', cmap={'A': 'blue', 'B': 'green', 'S': 'red', 'none': 'gray'}, alpha=0.5, tiles='OSM')
map2 = gdf2.hvplot(geo=True, c='class2', cmap={'abc':'white', 'def':'gray'}, legend=False)
map1 * map2

Am I missing something? Is it possible to get the legends of both layers display corrrectly?
geopandas  : 0.10.2
holoviews  : 1.14.9
hvplot     : 0.8.0
geoviews   : 1.9.5
bokeh      : 2.4.3