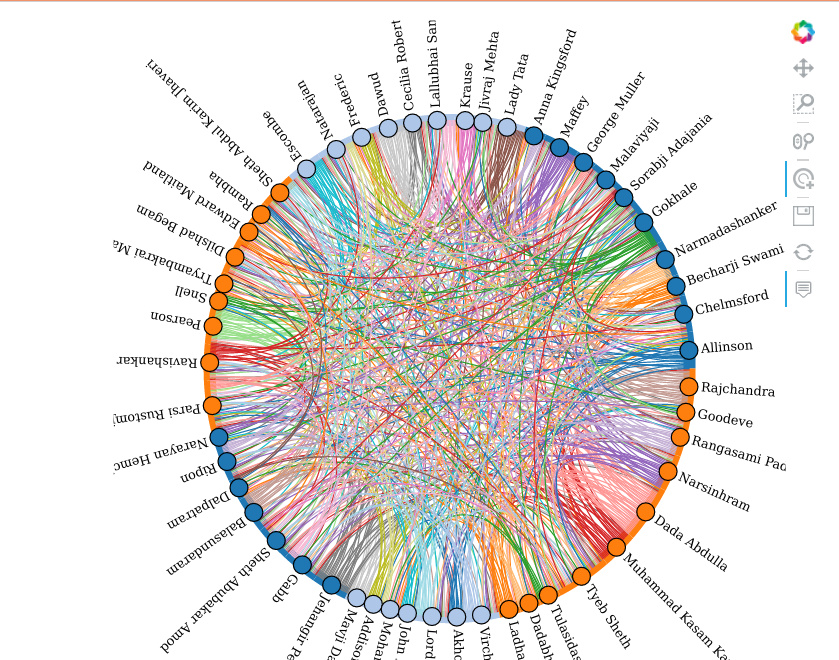
hi, how can i show legend in here ? i want to add description for node color/community label.
chord = hv.Chord((links, nodes)).select(value=(1, None))
chord.opts(opts.Chord(cmap=‘Category20’, edge_cmap=‘Category20’, edge_color=dim(‘source’).str(),
labels=‘name’, node_color=dim(‘group’).str()))
This is the code snippet.
@philippjfr, any workaround for this ?
how can these nodes be made clickable. does it have any option for it ?, meaning a new page should be opened when double clicked on a node.