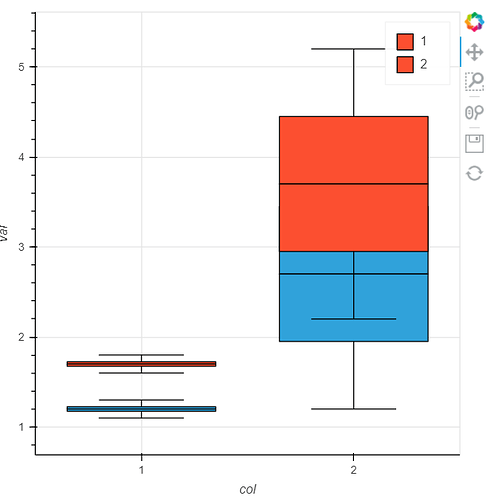
I am overlaying a bunch of boxwhisker plots. I would like to use the group column as a label for a box-plot in a legend:
import holoviews as hv
import pandas as pd

df = pd.DataFrame([
    ['A', 1, 1.1],
    ['A', 1, 1.2],
    ['A', 1, 1.3],
    ['A', 1, 1.2],
    ['A', 2, 2.2],
    ['A', 2, 1.2],
    ['A', 2, 3.2],
    ['A', 2, 4.2],
    ['B', 1, 1.6],
    ['B', 1, 1.7],
    ['B', 1, 1.8],
    ['B', 1, 1.7],
    ['B', 2, 3.2],
    ['B', 2, 5.2],
    ['B', 2, 4.2],
    ['B', 2, 2.2],
], columns=['group','col','val'])

olays = []
for group in df['group'].unique():
    box = hv.BoxWhisker(
        df.loc[df['group'] == group],
        kdims=['col'],
        vdims=['val'],
        label=group
    ).opts(
        show_grid=True,
        show_legend=True,
        height=500,
        width=500,
    )
    olays.append(box)
plot = hv.Overlay(olays).opts(show_legend=True)
plot
As you can see, the col column is used as label instead of the label attribute. How can I get the A and B labels into the legend? Thank you very much for you effort! Cheers.
