Some times ago I made an example of parallel plot for bokeh (https://github.com/bokeh/bokeh/tree/branch-2.4/examples/custom/parallel_plot)
However most of the time when I make some visualisations of my data I use holoviews
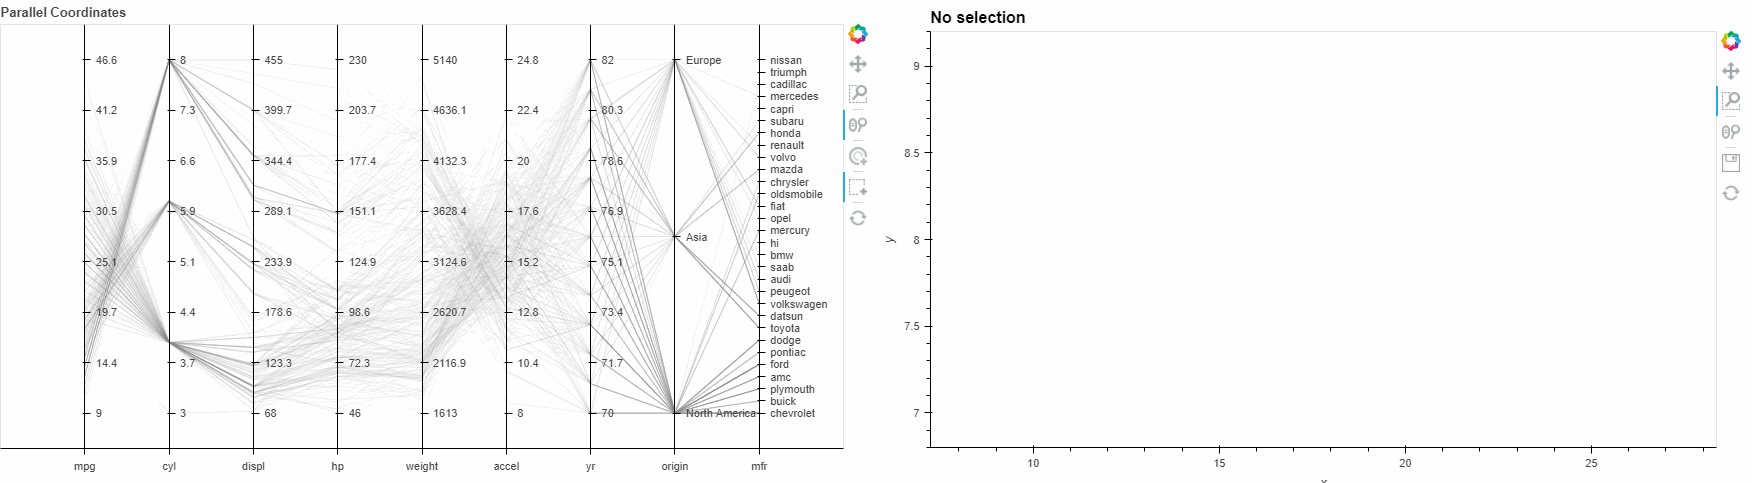
Here I show a simple example where I connect a bokeh parallel plot selection with an holoviews scatter plot through holoviews stream
The scatter plot is inspired from an holoviews example : https://holoviews.org/reference/streams/bokeh/Selection1D_points.html#streams-bokeh-gallery-selection1d-points
The demonstration is done through 2 cells of a notebook:
first cell is more or less a concatenation of the scripts found in the bokeh parallel plot example with some tweeaks to handle categorical columns in the dataframe:
import numpy as np

from bokeh.core.properties import Float, Instance
from bokeh.util.compiler import TypeScript
from bokeh.models import (ActionTool, BoxSelectTool, Renderer, BasicTickFormatter, ColumnDataSource,
                          FixedTicker, FuncTickFormatter, LinearAxis, LinearColorMapper, MultiLine,
                          Range1d, TapTool, CategoricalTicker, FactorRange, WheelZoomTool)
from bokeh.plotting import figure


RESET_CODE = """
import {ActionTool, ActionToolView} from "models/tools/actions/action_tool"
import * as p from "core/properties"

export class ParallelResetToolView extends ActionToolView {
  model: ParallelResetTool

  doit(): void {
    this.plot_view.reset_range()
  }
}

export namespace ParallelResetTool {
  export type Attrs = p.AttrsOf<Props>

  export type Props = ActionTool.Props
}

export interface ParallelResetTool extends ParallelResetTool.Attrs {}

export class ParallelResetTool extends ActionTool {
  properties: ParallelResetTool.Props
  __view_type__: ParallelResetToolView

  constructor(attrs?: Partial<ParallelResetTool.Attrs>) {
    super(attrs)
  }

  static init_ParallelResetTool(): void {
    this.prototype.default_view = ParallelResetToolView
  }

  tool_name = "Reset Zoom"
  icon = "bk-tool-icon-reset"
}
"""

SELECT_CODE  = """
import * as p from "core/properties"
import {BoxSelectTool, BoxSelectToolView} from "models/tools/gestures/box_select_tool"
import {Rect} from "models/glyphs/rect"
import {ColumnDataSource} from "models/sources/column_data_source"
import {GlyphRenderer} from "models/renderers/glyph_renderer"
import {ColumnarDataSource, MultiLine, Scale} from "models"
import {MoveEvent, PanEvent, TapEvent, KeyEvent} from "core/ui_events"
import {intersection, union, transpose} from "core/util/array"
import {SelectionMode} from "core/enums"
import {Keys} from "core/dom"

export interface HasRectCDS {
  glyph: Rect
  data_source: ColumnDataSource
}

export interface HasMultiLineCDS {
  glyph: MultiLine
  data_source: ColumnDataSource
}

type Action = "add" | "resize" | "drag"

type BoxParams = {
  x: number
  y: number
  h: number
  w: number
}

function find_indices_in(array: number[], [inf, sup]: [number, number]): number[] {
  return array.reduce((prev: number[], curr, index) =>
    (inf <= curr && curr <= sup) ? prev.concat(index) : prev, [])
}

function index_array(array: number[], indices: number[]): number[] {
  return indices.reduce((a: number[], i) => a.concat(array[i]), [])
}

function combineByKey(key: string, array: any[]) {
  const keys: string[] = Object.keys(array[0])
  const combined: any[] = []
  array.forEach((itm) => {
    const idx = combined.map(item => item[key]).indexOf(itm[key])
    if (idx >= 0) {
      keys.forEach(element => {
        if (element != key) combined[idx][element].push(itm[element])
      })
    } else {
      const new_object: any = {}
      keys.forEach(element => {
        if (element == key) {
          new_object[element] = itm[element]
        }
        else {
          new_object[element] = [itm[element]]
        }
      })
      combined.push(new_object)
    }
  })
  return combined
}


export class ParallelSelectionView extends BoxSelectToolView {
  model: ParallelSelectionTool

  private xscale: Scale
  private yscale: Scale
  private xdata: number[]
  private ydataT: number[][]
  private cds_select: ColumnDataSource
  private cds_data: ColumnDataSource
  private glyph_select: Rect
  private glyph_data: MultiLine
  private action: Action = "add"
  private ind_active_box: null | number
  private panning: boolean = false
  private _base_box_parameters: BoxParams | null
  private selection_indices: {
    data_idx: number
    indices: number[]
  }[] //must be synchronize with element of cds_select

  initialize(): void {
    super.initialize()

    const {frame} = this.plot_view

    const {x_range_name: x_range_name_select, y_range_name: y_range_name_select} = this.model.renderer_select
    const {x_range_name: x_range_name_data, y_range_name: y_range_name_data} = this.model.renderer_data

    if (x_range_name_select == x_range_name_data && y_range_name_select == y_range_name_data) {
      this.xscale = frame.x_scales.get(x_range_name_select)!
      this.yscale = frame.y_scales.get(y_range_name_select)!
    } else
      throw new Error("selection and data does not share the same ranges")

    //TODO test if parallel CDS is valid (xs for each line should be identical)
    this.glyph_select = this.model.renderer_select.glyph
    this.glyph_data = this.model.renderer_data.glyph

    this.cds_select = this.model.renderer_select.data_source
    this.cds_data = this.model.renderer_data.data_source

    const [xskey, yskey] = [(this.glyph_data as any).xs.field, (this.glyph_data as any).ys.field]
    this.xdata = this.cds_data.get_array(xskey)[0] as number[]
    this.ydataT = transpose(this.cds_data.get_array(yskey))
    this.selection_indices = []

    this.connect(frame.x_ranges.get(x_range_name_select)!.change, () => this._resize_boxes_on_zoom())
    this.connect(this.cds_select.change, () => this._update_data_selection())
  }

  get _box_width(): number {
    return this.xscale.invert(this.model.box_width) - this.xscale.invert(0)
  }

  get _cds_select_keys() {
    const glyph_select: any = this.glyph_select
    const [xkey, ykey] = [glyph_select.x.field, glyph_select.y.field]
    const [wkey, hkey] = [glyph_select.width.field, glyph_select.height.field]
    return {xkey, ykey, wkey, hkey}
  }

  _emit_cds_changes(cds: ColumnarDataSource, redraw: boolean = true,
      clear: boolean = true, emit: boolean = true): void {
    if (clear)
      cds.selection_manager.clear()
    if (redraw)
      cds.change.emit()
    if (emit) {
      cds.data = cds.data
      cds.properties.data.change.emit()
    }
  }

  _box_paramaters(index: number) {
    const {xkey, ykey, wkey, hkey} = this._cds_select_keys
    const x = this.cds_select.get_array<number>(xkey)[index]
    const y = this.cds_select.get_array<number>(ykey)[index]
    const w = this.cds_select.get_array<number>(wkey)[index]
    const h = this.cds_select.get_array<number>(hkey)[index]
    return {x, y, w, h}
  }

  _hit_test_boxes(sx: number, sy: number): number | null {
    const nboxes = this.cds_select.get_length()
    if (nboxes != 0 && nboxes != null) {
      const [xtest, ytest] = [this.xscale.invert(sx), this.yscale.invert(sy)]
      for (let i = 0; i < nboxes; i++) {
        const {x, y, w, h} = this._box_paramaters(i)
        if (xtest >= (x - w / 2) && xtest <= x + w / 2 &&
            ytest >= (y - h / 2) && ytest <= y + h / 2) {
          return i
        }
      }
    }

    return null
  }

  _resize_boxes_on_zoom() {
    //resize selection boxes when zooming to keep a constant (pixel) size
    const cds = this.cds_select
    const array_width = cds.get_array((this.glyph_select as any).width.field)
    const new_width = this._box_width
    array_width.forEach((_, i) => array_width[i] = new_width)
    this._emit_cds_changes(cds, true, false, false)
  }

  _drag_start(ev: PanEvent) {
    //Save y position of the drag start
    if (this.ind_active_box != null) {
      this._base_point = [this.xscale.invert(ev.sx), this.yscale.invert(ev.sy)]
      this._base_box_parameters = this._box_paramaters(this.ind_active_box)
    }
  }

  _update_box_ypos(index_box: number, delta_y: number) {
    if (this._base_box_parameters != null) {
      const cds = this.cds_select
      const {ykey} = this._cds_select_keys
      const {y: current_y, h} = this._base_box_parameters
      let new_y = current_y + delta_y
      new_y = new_y - Math.max(0, (new_y + h / 2) - 1) - Math.min(0, (new_y - h / 2))
      cds.get_array<number>(ykey)[index_box] = new_y
      this._emit_cds_changes(cds, true, false, false)
      this._update_selection_indices(index_box, [new_y - h / 2, new_y + h / 2])
    }
  }

  _drag(ev: PanEvent) {
    if (this.ind_active_box != null && this._base_point != null) {
      const delta_y = this.yscale.invert(ev.sy) - this._base_point[1]
      this._update_box_ypos(this.ind_active_box, delta_y)
    }
  }

  _drag_stop(_ev: PanEvent) {
    this._base_point = null
    this._base_box_parameters = null
  }

  _pan_start(ev: PanEvent) {
    this.panning = true
    switch (this.action) {
      case "add": {
        super._pan_start(ev)
        break
      }
      case "drag": {
        this._drag_start(ev)
        break
      }
      case "resize": {
        break
      }
    }
  }

  _pan(ev: PanEvent) {
    switch (this.action) {
      case "add": {
        super._pan(ev)
        break
      }
      case "drag": {
        this._drag(ev)
        break
      }
      case "resize": {
        break
      }
    }
  }

  _pan_end(ev: PanEvent) {
    switch (this.action) {
      case "add": {
        super._pan_end(ev)
        break
      }
      case "drag": {
        this._drag_stop(ev)
        break
      }
      case "resize": {
        break
      }
    }
    this.panning = false
  }

  _move(ev: MoveEvent) {
    //Switch mode
    if (this.panning) {return }
    this.ind_active_box = this._hit_test_boxes(ev.sx, ev.sy)
    if (this.ind_active_box != null) {
      this.action = "drag"
    } else {
      this.action = "add"
    }
  }

  _doubletap(_ev: TapEvent) {
    //delete box on double tap
    if (this.ind_active_box != null) {
      this.cds_select.columns().forEach(key => {
        this.cds_select.get_array(key).splice((this.ind_active_box as any), 1)
      })
      this._delete_selection_indices(this.ind_active_box)
      this._emit_cds_changes(this.cds_select)
    }
  }

  _keyup(ev: KeyEvent) {
    if (ev.keyCode == Keys.Esc) {
      const nelems = this.cds_select.get_length()
      if (nelems != null) {
        this.cds_select.columns().forEach(key => {
          this.cds_select.get_array(key).splice(0, nelems)
        })
        this.selection_indices.splice(0, nelems)
        this._emit_cds_changes(this.cds_select)
      }
      this.plot_view.request_render()
    }
  }

  _update_data_selection() {
    let selection_indices: number[] = []
    if (this.selection_indices.length > 0) {
      const combined_selections = combineByKey('data_idx', this.selection_indices)
      selection_indices = intersection(union<number>(...combined_selections[0].indices),
        ...combined_selections.slice(1).map(elem => union<number>(...elem.indices)))
    }
    this.cds_data.selected.indices = selection_indices
    this.cds_data.change.emit()
  }

  _make_selection_indices(indices: number[], [y0, y1]: [number, number]) {
    this.selection_indices.push(...indices.map(index => {
      return {
        data_idx: index,
        indices: find_indices_in(this.ydataT[index], [y0, y1]),
      }
    }))
  }

  _update_selection_indices(index: number, [y0, y1]: [number, number]) {
    this.selection_indices[index].indices = find_indices_in(this.ydataT[this.selection_indices[index].data_idx], [y0, y1])
  }

  _delete_selection_indices(index: number) {
    this.selection_indices.splice(index, 1)
  }

  _make_box_select(xs: number[], [y0, y1]: [number, number]): void {
    y0 = Math.max(0, y0)
    y1 = Math.min(1, y1)
    const y = (y0 + y1) / 2.
    const w = this._box_width
    const h = y1 - y0

    const {xkey, ykey, wkey, hkey} = this._cds_select_keys
    xs.forEach(x => {
      if (xkey) this.cds_select.get_array(xkey).push(x)
      if (ykey) this.cds_select.get_array(ykey).push(y)
      if (wkey) this.cds_select.get_array(wkey).push(w)
      if (hkey) this.cds_select.get_array(hkey).push(h)
    })
    this._emit_cds_changes(this.cds_select)
  }

  _do_select([sx0, sx1]: [number, number], [sy0, sy1]: [number, number], _final: boolean = true, _mode: SelectionMode): void {
    // Get selection bbox in the data space
    const [x0, x1] = this.xscale.r_invert(sx0, sx1)
    const [y0, y1] = this.yscale.r_invert(sy0, sy1)

    const x_indices = find_indices_in(this.xdata, [x0, x1])

    const xs = index_array(this.xdata, x_indices)

    this._make_selection_indices(x_indices, [y0, y1])
    this._make_box_select(xs, [y0, y1])
  }
}

export namespace ParallelSelectionTool {
  export type Attrs = p.AttrsOf<Props>

  export type Props = BoxSelectTool.Props & {
    renderer_select: p.Property<GlyphRenderer & HasRectCDS>
    renderer_data: p.Property<GlyphRenderer & HasMultiLineCDS>
    box_width: p.Property<number>
  }
}

export interface ParallelSelectionTool extends ParallelSelectionTool.Attrs {}

export class ParallelSelectionTool extends BoxSelectTool {
  properties: ParallelSelectionTool.Props
  __view_type__: ParallelSelectionView

  static init_ParallelSelectionTool(): void {
    this.prototype.default_view = ParallelSelectionView

    this.define<ParallelSelectionTool.Props>(({Number, AnyRef}) => ({
      renderer_select: [ AnyRef<GlyphRenderer & HasRectCDS>() ],
      renderer_data:   [ AnyRef<GlyphRenderer & HasMultiLineCDS>() ],
      box_width:       [ Number, 30 ],
    }))
  }

  tool_name = "Parallel Selection"
  //override event_type property define in BoxSelectTool
  event_type: any = ["tap" as "tap", "pan" as "pan", "move" as "move"]
}
"""


class ParallelResetTool(ActionTool):
    """ Tool to reset only plot axes and not selections
    """

    __implementation__ = TypeScript(RESET_CODE)


class ParallelSelectionTool(BoxSelectTool):
    """ Selection tool for parallel plot
    To create a selection box, drag the selection around an axe
    When hovering a selection the box can be dragged upside-down
    Double click on a selection to remove it
    Escape key remove all selections
    """

    __implementation__ = TypeScript(SELECT_CODE)
    renderer_select = Instance(Renderer, help="Rectangular Selections glyphs")
    renderer_data = Instance(Renderer, help="MultiLine glyph of the data")
    box_width = Float(help="Width size in the screen coordinate of selection boxes")

def parallel_plot(df_raw, drop=None, color=None, palette=None):
    """From a dataframe create a parallel coordinate plot
    """
    if drop is not None:
        df = df_raw.drop(drop, axis=1)
    else:
        df = df_raw.copy()
    npts = df.shape[0]
    ndims = len(df.columns)

    if color is None:
        color = np.ones(npts)
    if palette is None:
        palette = ['#ff0000']
    if color.dtype == np.object_:
        color = color.apply(lambda elem: np.where(color.unique()==elem)[0].item())
    cmap = LinearColorMapper(high=color.min(),
                             low=color.max(),
                             palette=palette)
    categorical_columns = df.columns.where(df.dtypes==np.object_).dropna()
    for col in categorical_columns:
        df[col] = df[col].apply(lambda elem: np.where(df[col].unique()==elem)[0].item())

    data_source = ColumnDataSource(dict(
        xs=np.arange(ndims)[None, :].repeat(npts, axis=0).tolist(),
        ys=np.array((df-df.min())/(df.max()-df.min())).tolist(),
        color=color))


    p = figure(x_range=(-1, ndims),
               y_range=(0, 1),
               width=1000,
               tools="pan, box_zoom")

    # Create x axis ticks from columns contained in dataframe
    fixed_x_ticks = FixedTicker(
        ticks=np.arange(ndims), minor_ticks=[])
    formatter_x_ticks = FuncTickFormatter(
        code="return columns[index]", args={"columns": df.columns})
    p.xaxis.ticker = fixed_x_ticks
    p.xaxis.formatter = formatter_x_ticks

    p.yaxis.visible = False
    p.y_range.start = 0
    p.y_range.end = 1
    p.y_range.bounds = (-0.1, 1.1) # add a little padding around y axis
    p.xgrid.visible = False
    p.ygrid.visible = False

    # Create extra y axis for each dataframe column
    tickformatter = BasicTickFormatter(precision=1)
    for index, col in enumerate(df.columns):
        start = df[col].min()
        end = df[col].max()
        bound_min = start + abs(end-start) * (p.y_range.bounds[0] - p.y_range.start)
        bound_max = end + abs(end-start) * (p.y_range.bounds[1] - p.y_range.end)
        range1d = Range1d(start=bound_min, end=bound_max, bounds=(bound_min, bound_max))
        p.extra_y_ranges.update({col: range1d})
        if col not in categorical_columns:
            fixedticks = FixedTicker(
                ticks=np.linspace(start, end, 8), minor_ticks=[])
            major_label_overrides = {}
        else:
            fixedticks = FixedTicker(
                ticks=np.arange(end+1), minor_ticks=[])
            major_label_overrides = {i: str(name) for i, name in enumerate(df_raw[col].unique())}


        p.add_layout(LinearAxis(fixed_location=index, y_range_name=col,
                                ticker=fixedticks, formatter=tickformatter, major_label_overrides=major_label_overrides), 'right')


    # create the data renderer ( MultiLine )
    # specify selected and non selected style
    non_selected_line_style = dict(line_color='grey', line_width=0.1, line_alpha=0.5)

    selected_line_style = dict(line_color={'field': 'color', 'transform': cmap}, line_width=1)

    parallel_renderer = p.multi_line(
        xs="xs", ys="ys", source=data_source, **non_selected_line_style)

    # Specify selection style
    selected_lines = MultiLine(**selected_line_style)

    # Specify non selection style
    nonselected_lines = MultiLine(**non_selected_line_style)

    parallel_renderer.selection_glyph = selected_lines
    parallel_renderer.nonselection_glyph = nonselected_lines
    p.y_range.start = p.y_range.bounds[0]
    p.y_range.end = p.y_range.bounds[1]

    rect_source = ColumnDataSource({
        'x': [], 'y': [], 'width': [], 'height': []
    })

    # add rectangle selections
    selection_renderer = p.rect(x='x', y='y', width='width', height='height',
                                source=rect_source,
                                fill_alpha=0.7, fill_color='#009933')
    selection_tool = ParallelSelectionTool(
        renderer_select=selection_renderer, renderer_data=parallel_renderer,
        box_width=10)
    # custom resets (reset only axes not selections)
    reset_axes = ParallelResetTool()

    # add tools and activate selection ones
    p.add_tools(selection_tool, reset_axes, TapTool(), WheelZoomTool())
    p.toolbar.active_drag = selection_tool
    return p
the second cell import data create bokeh plot link the selection to an holoviews dynamic map and display both graph through panel:
import panel as pn
import holoviews as hv
import pandas as pd
from bokeh.palettes import Viridis256
from bokeh.sampledata.autompg import autompg_clean as df
pn.extension()

# make bokeh parallel plot
p = parallel_plot(df, drop="name", color=df.origin, palette=Viridis256)
p.xaxis.axis_label = ' '
p.title = "Parallel Coordinates"

# link bokeh datasource to holoviews stream
data_source = p.renderers[0].data_source
stream1d = hv.streams.Selection1D()
data_source.selected.on_change("indices", lambda attr, old, new: stream1d.event(index=new))

# Declare some scatter plot
scatter = hv.Scatter((df['mpg'], df['cyl']))

# Write function that uses the parallel plot selection indices to slice scatter plot and compute stats
def selected_info(index):
    selected = scatter.iloc[index]
    if index:
        label = 'Mean x, y: %.3f, %.3f' % tuple(selected.array().mean(axis=0))
    else:
        label = 'No selection'
    return selected.relabel(label).opts(color='red')

pan = pn.Row(pn.panel(p, sizing_mode="stretch_both", height=500), pn.pane.HoloViews(hv.DynamicMap(selected_info, streams=[stream1d]).opts(framewise=True, axiswise=True, responsive=True), sizing_mode='stretch_both'))
pan.servable()