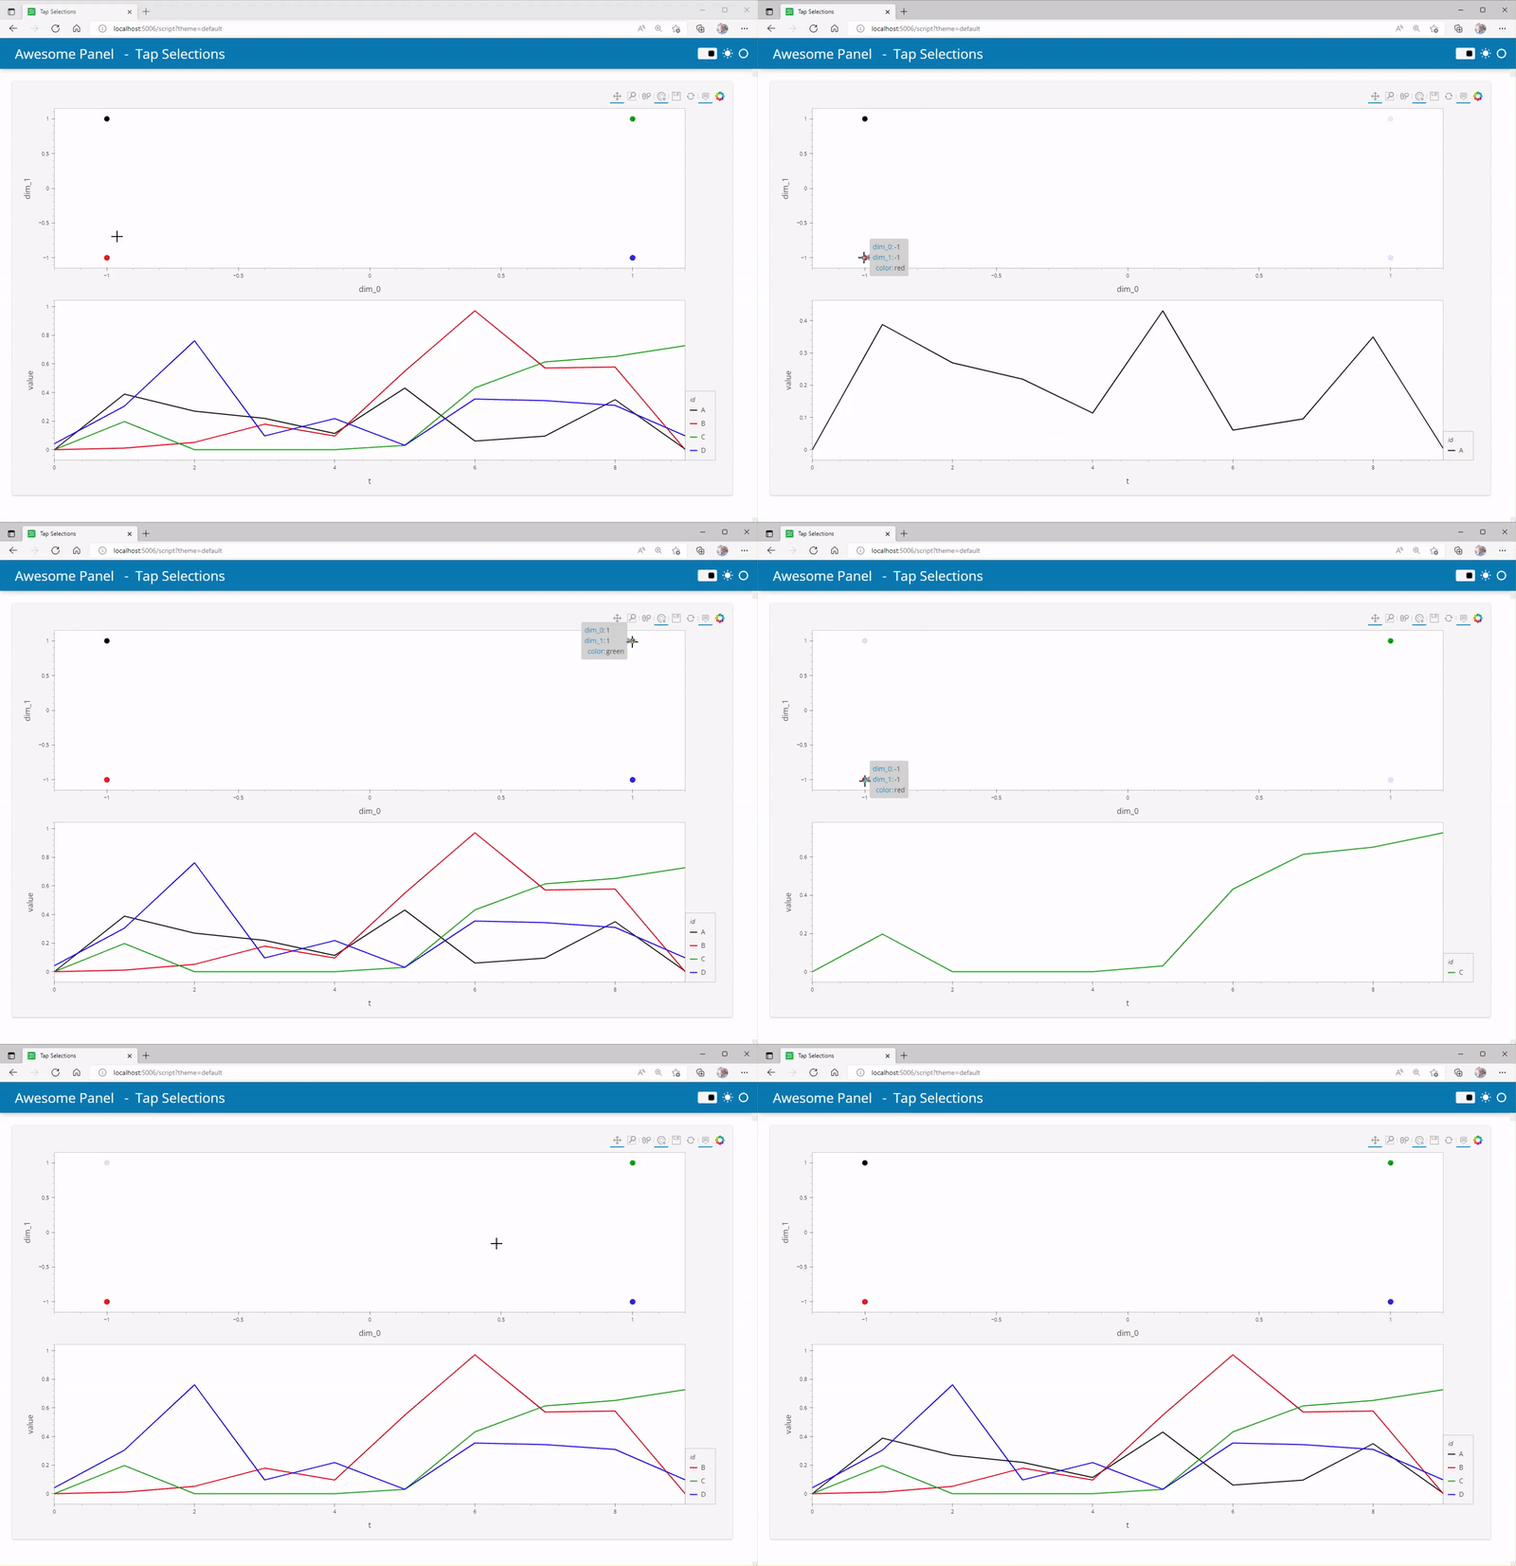
Hi @aberges-grd
I would do it something like the below

import hvplot.pandas
import numpy as np
import pandas as pd
import panel as pn

import holoviews as hv

pn.extension(sizing_mode="stretch_width", template="fast")
pn.state.template.param.update(site="Awesome Panel", title="Tap Selections")

CMAP = {
    "A": "black", "B": "red", "C": "green", "D": "blue"
}

embedded_df = pd.DataFrame([("A", -1, 1), ("B", -1, -1), ("C", 1, 1), ("D", 1, -1)], columns = ["id","dim_0", "dim_1"])
embedded_df["color"]=embedded_df["id"].map(CMAP)
timeseries_df = pd.DataFrame(
    {
        "t": [ 0, 1, 2, 3, 4, 5, 6, 7, 8, 9, 0, 1, 2, 3, 4, 5, 6, 7, 8, 9, 0, 1, 2, 3, 4, 5, 6, 7, 8, 9, 0, 1, 2, 3, 4, 5, 6, 7, 8, 9 ],
        "id": [ "A", "A", "A", "A", "A", "A", "A", "A", "A", "A", "B", "B", "B", "B", "B", "B", "B", "B", "B", "B", "C", "C", "C", "C", "C", "C", "C", "C", "C", "C", "D", "D", "D", "D", "D", "D", "D", "D", "D", "D", ],
        "value": [ 0.0, 0.3882388238823883, 0.269126912691269, 0.2187218721872186, 0.11356135613561347, 0.43069306930693074, 0.06075607560756059, 0.09525952595259543, 0.3496849684968495, 0.004050405040504059, 0.0, 0.010850694444444442, 0.05164930555555558, 0.17838541666666669, 0.09592013888888887, 0.5494791666666664, 0.9713541666666666, 0.5716145833333334, 0.5776909722222223, 0.0, 0.0, 0.19696969696969696, 0.0, 0.0, 0.0, 0.030303030303030276, 0.43181818181818166, 0.6136363636363633, 0.6515151515151514, 0.7268502872592094, 0.04166666666666667, 0.3044541737723557, 0.7619348244348243, 0.0962301587301587, 0.21771284271284302, 0.030513468013467965, 0.3541666666666663, 0.34328403078403086, 0.30949374699374693, 0.09686147186147182, ],
    }
)
timeseries_df["color"]=timeseries_df["id"].map(CMAP)

scatter_plot = embedded_df.hvplot.scatter(x="dim_0", y="dim_1", c="color", tools=['hover', 'tap'], responsive=True, height=400, size=10).opts(size=10)
selection = hv.streams.Selection1D(source=scatter_plot)

def selection_ts(index):
    df = timeseries_df.copy()

    if index:
        selected_ids = embedded_df[embedded_df.index.isin(index)]["id"].unique()
        df = df[df["id"].isin(selected_ids)]
    return df.hvplot(x="t", y="value", by="id", c="color", responsive=True, height=400, size=10)

selected_points = hv.DynamicMap(selection_ts, streams=[selection])
layout = (scatter_plot+ selected_points).cols(1)

pn.pane.HoloViews(layout, sizing_mode="stretch_both").servable()
run it with
panel serve script.py --autoreload --show