He everyone,
Is there any chance that Panel would implement LiteGraphJS anytime soon?
Looks mighty powerful and very useful
There are already a few standalone implementations in python example
He everyone,
Is there any chance that Panel would implement LiteGraphJS anytime soon?
Looks mighty powerful and very useful
There are already a few standalone implementations in python example
Hi @ljilekor1
You could try to make a Feature Request describing your use case link.
Try to describe your use case, how you would like to use it and why it would be important for Panel to support.
For now one way to integrate litegraph.js would be to use ReactiveHTML.
Here is a basic example
import panel as pn
import param
pn.extension(sizing_mode="stretch_width", template="fast")
class LiteGraph(pn.reactive.ReactiveHTML):
value = param.Dict()
save = param.Event()
_template = """
<div id="container" style="height:100%;width:100%">
<canvas id='litegraph' style='border: 1px solid'></canvas>
</div>
"""
_scripts = {
"render": """
self.resize_canvas()
var graph = new LGraph();
var canvas = new LGraphCanvas(litegraph, graph, {autoresize: true});
graph.start()
state.graph=graph
self.load()
""",
"resize_canvas": """
litegraph.setAttribute("height", model.height);
litegraph.setAttribute("width", model.width);
""",
"save": """
var graph=state.graph;
var value=state.graph.serialize();
console.log(value)
data.value=value;
""",
"load": "state.graph.configure(data.value);",
"value": "self.load()",
}
__javascript__ = [
"https://cdn.jsdelivr.net/gh/jagenjo/litegraph.js@master/build/litegraph.min.js"
]
__css__ = ["https://cdn.jsdelivr.net/gh/jagenjo/litegraph.js@master/css/litegraph.css"]
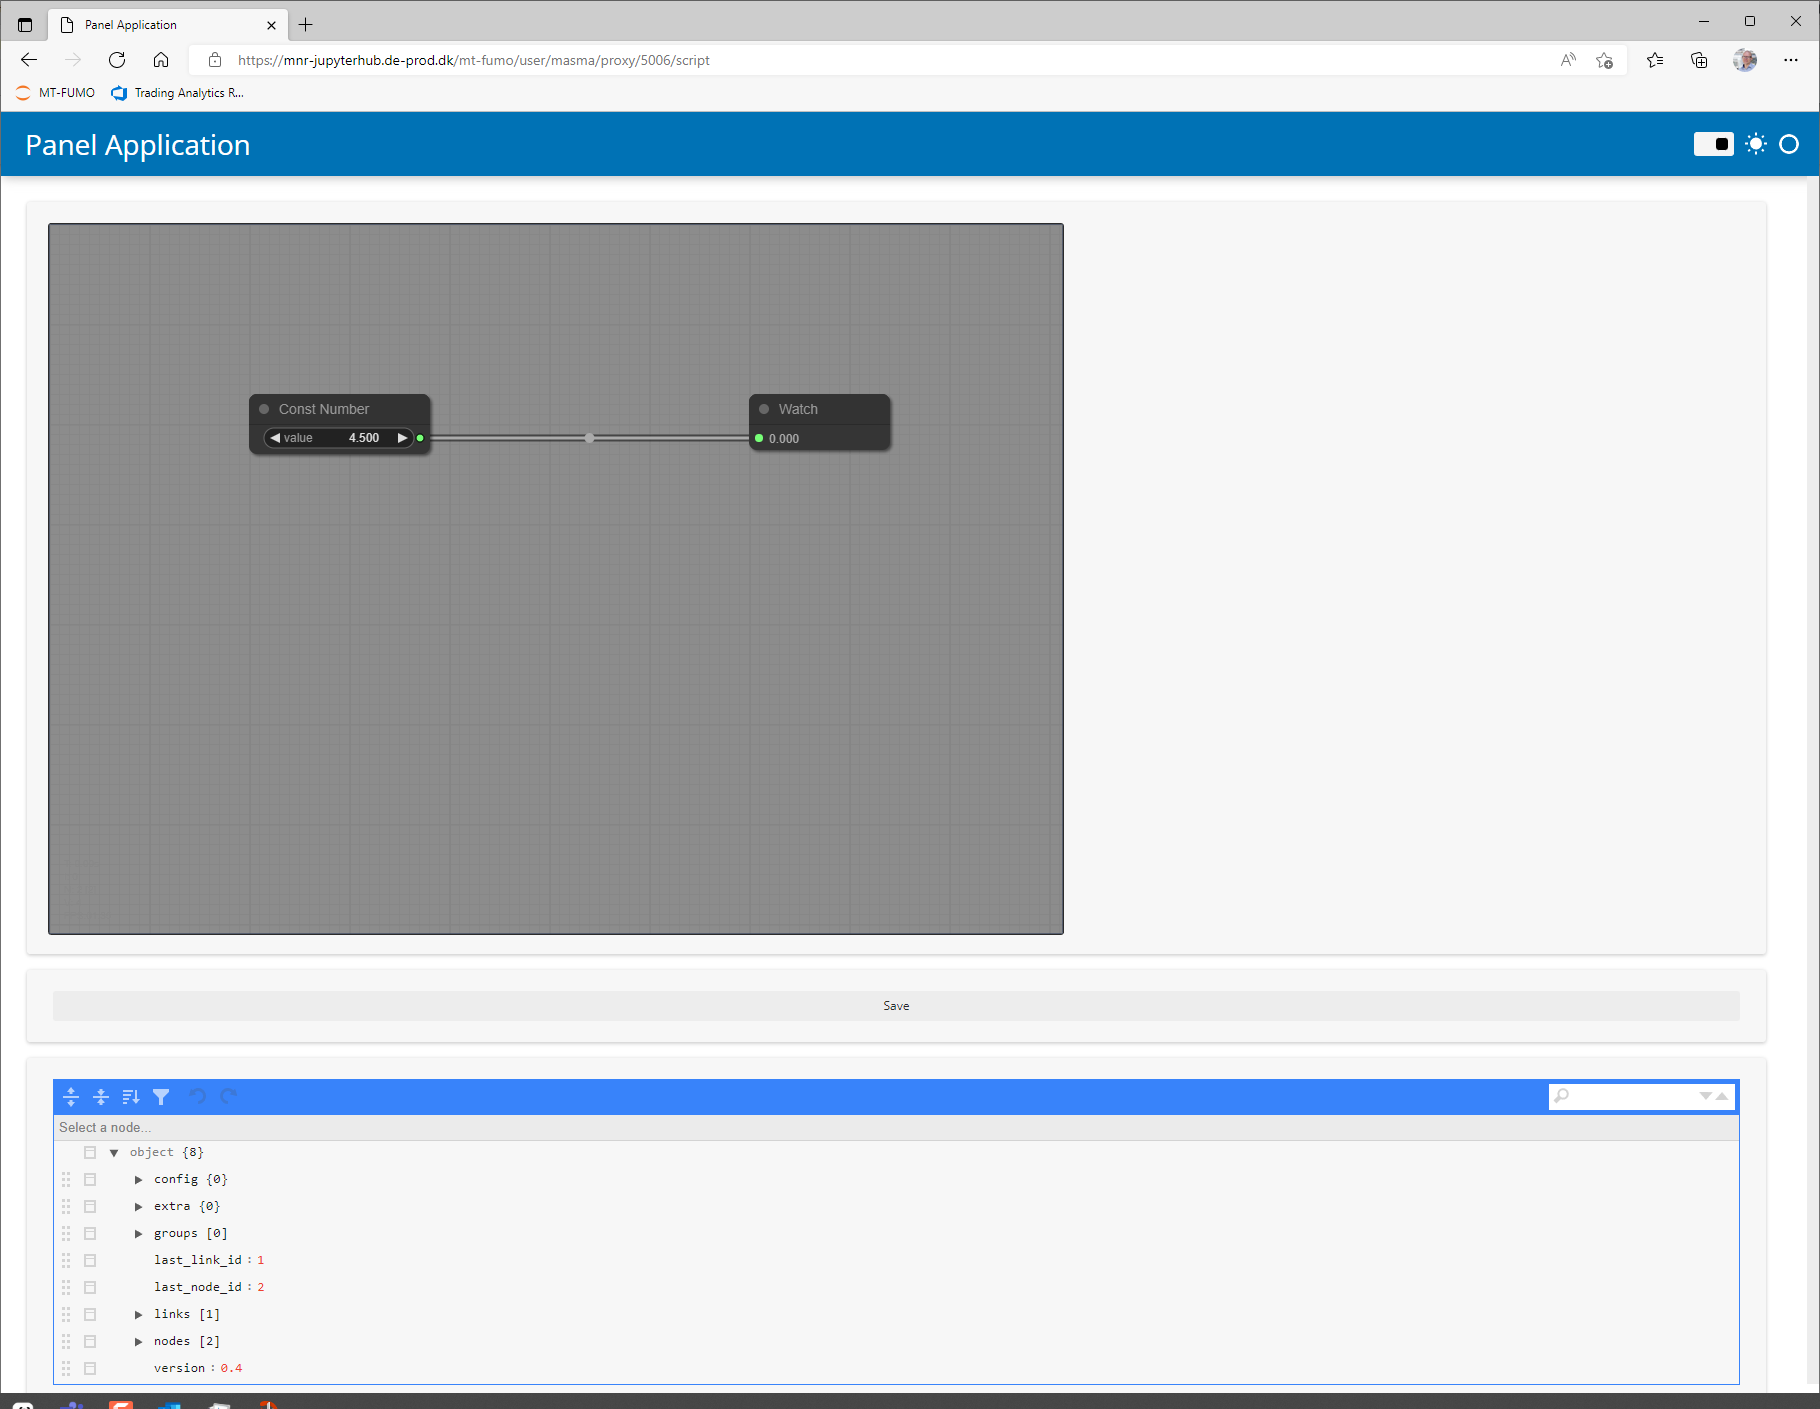
value = {
"last_node_id": 2,
"last_link_id": 1,
"nodes": [
{
"id": 1,
"type": "basic/const",
"pos": [200, 200],
"size": [180, 30],
"flags": {},
"order": 0,
"mode": 0,
"outputs": [{"name": "value", "type": "number", "links": [1], "label": "4.500"}],
"properties": {"value": 4.5},
},
{
"id": 2,
"type": "basic/watch",
"pos": [700, 200],
"size": [140, 26],
"flags": {},
"order": 1,
"mode": 0,
"inputs": [{"name": "value", "type": 0, "link": 1, "label": ""}],
"properties": {},
},
],
"links": [[1, 1, 0, 2, 0, "number"]],
"groups": [],
"config": {},
"extra": {},
"version": 0.4,
}
# Can only support fixed sizing_mode for now
graph = LiteGraph(value=value, width=1024, height=720, sizing_mode="fixed").servable()
button = pn.widgets.Button.from_param(graph.param.save).servable()
json = pn.widgets.JSONEditor.from_param(graph.param.value).servable()
@pn.depends(graph.param.value, watch=True)
def _print(value):
print(value)
Some issues currently
sizing_mode="stretch_width"
save does not work. I see an error in the browser console when clicking saveOne comment is that the documentation and examples of litegraph.js is quite sparse. There might be other libraries out there that are easier to implement.
Holy Smokes!! It is possible!
Big thanks Marc for showing us the nitty gritty on how to do this