Hi, we have been building a lot of Panel apps and wonder if there exists an LLM tool that can help answer Panel / Param / Bokeh related queries while building complex Panel apps given a user requirement.
Thanks!
Hi, we have been building a lot of Panel apps and wonder if there exists an LLM tool that can help answer Panel / Param / Bokeh related queries while building complex Panel apps given a user requirement.
Thanks!
At the moment, there’s no LLM tool that is fine-tuned for Panel/Param/Bokeh, but in my experience, the SOTA models are capable of writing decent Panel apps, and perhaps could be improved by pasting in the best practices: Apply best practices — Panel v1.6.1
I tried using Gemini 2.5 Pro (preview) with this prompt:
Using the code at hurricane-ike-water-levels/hurricane_ike_water_levels.ipynb at 9fd6a92cd58feca4f5b5cc3e462d4e04c3a74067 · reproducible-notebooks/hurricane-ike-water-levels · GitHub for the visualization approach, write a python function (with example) that takes an xarray dataset on input and generates a Panel dashboard on output.
The input xarray dataset has geospatial data from a triangular mesh (unstructured grid) numerical ocean model, and contains data variables on the nodes of the triangular mesh, along with variables containing the latitude, longitude locations of the nodes, and a connectivity array variable that describes the topology of the grid. Some of the data variables have only a single coordinate (node), some data variables have coordinates of (time, node) and some data variables have coordinates of (time, node, vertical_level).
The Panel dashboard app should allow users to select using widgets which data variable they are interested in, which time step, and which vertical level (as appropriate for the variable selected). The selected data should then be displayed on a geographic map by constructing a 3 column dataframes of the triangle connectivity and a 3 column dataframe containing the longitude, latitude and the data from one of the variables (at a specified time and level) and creating a TriMesh geoviews object that can be passed to datashader’s shade function (with a specified colormap) to create a colored triangular mesh plot that indicates the data values.
The app should follow the best practices described on Apply best practices — Panel v1.7.0
The app should use the panel 1.7 api described at API Reference — Panel v1.7.0
And this is what is returned:
import xarray as xr
import numpy as np
import pandas as pd
import panel as pn
import geoviews as gv
import holoviews as hv
import holoviews.operation.datashader as hds # For datashader operations like rasterize and aggregators
import datashader as ds_agg # For datashader aggregators like mean, sum, etc.
import matplotlib.pyplot as plt # For colormaps

# Initialize Panel and GeoViews extensions
# 'bokeh' is the default backend for geoviews in Panel
# Using ' επίσης' in sizing_mode="stretch_width" could be useful for some templates
pn.extension(sizing_mode="stretch_width")
gv.extension('bokeh')

def find_var_or_coord_name(ds, potential_names, default_name=None):
    """Helper to find a variable or coordinate name in the dataset."""
    for name in potential_names:
        if name in ds: # Checks both data_vars and coords
            return name
    if default_name and default_name in ds:
        return default_name
    # If not found, and no default, let it raise error later or handle by caller
    return None

def find_dim_name(ds, potential_names, default_name=None):
    """Helper to find a dimension name in the dataset."""
    for name in potential_names:
        if name in ds.dims:
            return name
    if default_name and default_name in ds.dims:
        return default_name
    return None

def create_geospatial_dashboard(ds: xr.Dataset,
                                lon_var_names=['longitude', 'lon', 'mesh2d_node_x', 'node_lon'],
                                lat_var_names=['latitude', 'lat', 'mesh2d_node_y', 'node_lat'],
                                conn_var_names=['connectivity', 'triangles', 'faces', 'mesh2d_face_nodes', 'elements'],
                                node_dim_names=['node', 'nodes', 'nSCHISM_hgrid_node', 'nMeshNode'],
                                time_dim_names=['time', 'datetime'],
                                level_dim_names=['level', 'vertical_level', 'layer', 'nz']
                               ) -> pn.viewable.Viewable:
    """
    Generates a Panel dashboard for visualizing geospatial data from an xarray Dataset
    representing a triangular mesh.

    Args:
        ds (xr.Dataset): The input xarray dataset. It should contain:
            - Longitude coordinates for nodes.
            - Latitude coordinates for nodes.
            - A connectivity array for triangles (e.g., (n_triangles, 3)).
            - Data variables defined on the nodes, potentially with time and/or vertical level dimensions.
        lon_var_names (list): Potential names for the longitude variable.
        lat_var_names (list): Potential names for the latitude variable.
        conn_var_names (list): Potential names for the connectivity variable.
        node_dim_names (list): Potential names for the node dimension.
        time_dim_names (list): Potential names for the time dimension.
        level_dim_names (list): Potential names for the vertical level dimension.

    Returns:
        pn.viewable.Viewable: A Panel dashboard object.
    """

    # --- 1. Identify key variables and dimensions ---
    lon_name = find_var_or_coord_name(ds, lon_var_names)
    lat_name = find_var_or_coord_name(ds, lat_var_names)
    conn_name = find_var_or_coord_name(ds, conn_var_names)

    if not all([lon_name, lat_name, conn_name]):
        missing = [name for name, var in zip(
            ["Longitude", "Latitude", "Connectivity"], [lon_name, lat_name, conn_name]) if not var]
        raise ValueError(f"Could not find required variables: {', '.join(missing)}. "
                         f"Please check dataset or provide correct names via arguments.")

    # Infer node dimension from lon/lat variables if not explicitly found via node_dim_names list
    node_dim_name = find_dim_name(ds, node_dim_names)
    if not node_dim_name:
        if lon_name in ds.variables and len(ds[lon_name].dims) == 1:
            node_dim_name = ds[lon_name].dims[0]
        elif lat_name in ds.variables and len(ds[lat_name].dims) == 1:
            node_dim_name = ds[lat_name].dims[0]
        else: # Try finding a common dimension for lon and lat
            common_dims = list(set(ds[lon_name].dims) & set(ds[lat_name].dims))
            if len(common_dims) == 1:
                node_dim_name = common_dims[0]
            else:
                 raise ValueError("Could not unambiguously infer node dimension. "
                                  "Ensure longitude/latitude variables have a single, shared dimension, "
                                  "or provide its name via 'node_dim_names'.")

    time_dim_name = find_dim_name(ds, time_dim_names)
    level_dim_name = find_dim_name(ds, level_dim_names)

    # --- 2. Get list of plottable data variables ---
    # Exclude coordinates, connectivity var, and non-node-based variables
    excluded_vars = list(ds.coords) + [lon_name, lat_name, conn_name]
    # Also exclude variables that are just dimensions (if they appear in data_vars)
    excluded_vars.extend([d for d in ds.dims if d in ds.data_vars])

    data_vars = sorted([
        var for var in ds.data_vars
        if var not in excluded_vars and node_dim_name in ds[var].dims
    ])

    if not data_vars:
        return pn.pane.Alert("No suitable data variables found for plotting in the dataset. "
                             "Ensure variables have the identified node dimension ('{node_dim_name}').", alert_type='danger')

    # --- 3. Create Widgets ---
    variable_select = pn.widgets.Select(name='Select Data Variable', options=data_vars, value=data_vars[0], width_policy='max')

    time_options_map = {} # To map display strings to actual coordinate values
    level_options_map = {}

    time_select = pn.widgets.Select(name='Time Step', options=[], visible=False, width_policy='max')
    level_select = pn.widgets.Select(name='Vertical Level', options=[], visible=False, width_policy='max')

    available_cmaps = sorted(plt.colormaps())
    cmap_select = pn.widgets.Select(name='Colormap', options=available_cmaps, value='viridis', width_policy='max')

    # --- Callback to update time/level widgets based on selected variable ---
    @pn.depends(variable_select.param.value, watch=True)
    def _update_time_level_widgets(selected_var_name):
        nonlocal time_options_map, level_options_map # Allow modification of these maps
        if not selected_var_name:
            time_select.visible = False
            level_select.visible = False
            return

        var_dims = ds[selected_var_name].dims

        time_options_map.clear()
        if time_dim_name and time_dim_name in var_dims and ds[time_dim_name].size > 0:
            time_coords = ds[time_dim_name].values
            if np.issubdtype(ds[time_dim_name].dtype, np.datetime64):
                # Format datetime for display, map to original numpy.datetime64 value
                time_options_map = {str(pd.to_datetime(t)): t for t in time_coords}
            else:
                time_options_map = {str(t): t for t in time_coords}

            time_select.options = list(time_options_map.keys())
            if time_select.options:
                 time_select.value = time_select.options[0] # Select first time step by default
            time_select.visible = True
        else:
            time_select.options = []
            time_select.value = None # Reset value
            time_select.visible = False

        level_options_map.clear()
        if level_dim_name and level_dim_name in var_dims and ds[level_dim_name].size > 0:
            level_coords = ds[level_dim_name].values
            level_options_map = {str(l): l for l in level_coords}
            level_select.options = list(level_options_map.keys())
            if level_select.options:
                level_select.value = level_select.options[0] # Select first level by default
            level_select.visible = True
        else:
            level_select.options = []
            level_select.value = None # Reset value
            level_select.visible = False

    # Initial call to set widget states based on the default selected variable
    _update_time_level_widgets(variable_select.value)

    # --- 4. Plotting function bound to widgets ---
    @pn.bind(variable_name=variable_select, time_key=time_select,
             level_key=level_select, cmap_name=cmap_select)
    def create_plot(variable_name, time_key, level_key, cmap_name):
        if not variable_name:
            return pn.pane.Markdown("### Please select a data variable.", sizing_mode="stretch_both")

        data_array = ds[variable_name]
        selector = {}

        # Use the mapped coordinate values for selection
        if time_select.visible and time_key is not None and time_dim_name in data_array.dims:
            selector[time_dim_name] = time_options_map.get(time_key)

        if level_select.visible and level_key is not None and level_dim_name in data_array.dims:
            selector[level_dim_name] = level_options_map.get(level_key)

        # Perform selection if selector has items, otherwise use original array (for static vars)
        if selector:
            selected_data_array = data_array.sel(**selector)
        else:
            selected_data_array = data_array

        # Squeeze out selected dimensions to get data on nodes
        # Check if any of the target dimensions (time, level) are still present with size 1
        # and squeeze them if so.
        for dim_to_squeeze in [time_dim_name, level_dim_name]:
            if dim_to_squeeze and dim_to_squeeze in selected_data_array.dims and selected_data_array[dim_to_squeeze].size == 1:
                selected_data_array = selected_data_array.squeeze(dim_to_squeeze, drop=True)

        if node_dim_name not in selected_data_array.dims or len(selected_data_array.dims) != 1:
             return pn.pane.Alert(
                 f"Data for plotting does not have the expected single dimension '{node_dim_name}' after selection. "
                 f"Current dimensions: {selected_data_array.dims}. Expected data shape: ({node_dim_name},). "
                 f"Selected variable: {variable_name}, Time: {time_key}, Level: {level_key}.",
                 alert_type='danger', sizing_mode="stretch_width")

        data_values = selected_data_array.data # .data or .values to get numpy array

        # Prepare TriMesh data
        lon_coords = ds[lon_name].data
        lat_coords = ds[lat_name].data

        # Ensure data_values align with lon/lat if node_dim_name was not the only dim initially
        # This assumes selected_data_array still has the original node_dim_name and values are aligned.
        # If data_values is not 1D and matching length of lon_coords, it's an issue.
        if not (data_values.ndim == 1 and len(data_values) == len(lon_coords)):
            return pn.pane.Alert(
                f"Mismatch between node coordinate length ({len(lon_coords)}) and data values length ({len(data_values)}) "
                f"or data is not 1D after selection (ndim={data_values.ndim}).",
                alert_type='danger', sizing_mode="stretch_width")

        # Create DataFrame for vertices (nodes) expected by gv.TriMesh (x, y, z columns)
        # Ensure no NaNs in coordinates, data NaNs are handled by datashader/colormap
        if np.isnan(lon_coords).any() or np.isnan(lat_coords).any():
            return pn.pane.Alert("Longitude or Latitude coordinates contain NaNs.", alert_type='danger', sizing_mode="stretch_width")

        verts_df = pd.DataFrame({
            'x': lon_coords, # GeoViews TriMesh expects 'x', 'y' for coordinates
            'y': lat_coords,
            'z': data_values # 'z' is the data value for coloring
        })

        # Connectivity: ensure it's (num_triangles, 3) and 0-indexed
        conn_array_full = ds[conn_name].data
        if conn_array_full.ndim != 2 or conn_array_full.shape[1] < 3:
            return pn.pane.Alert(
                f"Connectivity array '{conn_name}' does not have expected shape (N, >=3). "
                f"Shape is {conn_array_full.shape}.", alert_type='danger', sizing_mode="stretch_width")

        conn_array = conn_array_full[:, :3].astype(int) # Take first 3 columns for triangles

        # Check if 1-indexed (heuristic: if min value is 1 and max is num_nodes)
        # A more robust check would be if min is 1 and max is exactly len(lon_coords)
        if conn_array.min() == 1 and conn_array.max() == len(lon_coords):
            conn_array = conn_array - 1
        elif conn_array.min() < 0 or conn_array.max() >= len(lon_coords):
             return pn.pane.Alert(
                f"Connectivity indices are out of bounds [0, {len(lon_coords)-1}]. "
                f"Min index: {conn_array.min()}, Max index: {conn_array.max()}.",
                alert_type='danger', sizing_mode="stretch_width")

        triangles_df = pd.DataFrame(conn_array, columns=['v0', 'v1', 'v2'])

        if verts_df.empty or triangles_df.empty:
            return pn.pane.Alert("No data to plot (vertices or triangles are empty).",
                                 alert_type='warning', sizing_mode="stretch_width")

        try:
            # Create GeoViews TriMesh
            # gv.TriMesh((verts_df_with_xyz, triangles_df))
            trimesh_gv = gv.TriMesh((verts_df, triangles_df)) # kdims=['x','y'], vdims=['z'] inferred

            # Filter out NaNs for robust min/max calculation for color limits
            valid_z_values = verts_df['z'].dropna()
            if valid_z_values.empty:
                clim = (0, 1) # Default if all NaNs or empty
                plot_title = f"{variable_name} (All NaNs)"
            else:
                cmin, cmax = float(valid_z_values.min()), float(valid_z_values.max())
                if cmin == cmax: # Adjust if all values are the same
                    cmin -= 0.5
                    cmax += 0.5
                clim = (cmin, cmax)
                plot_title = f"{variable_name}"

            if time_key: plot_title += f" at {time_key}"
            if level_key: plot_title += f" on level {level_key}"

            # Datashade the TriMesh using rasterize
            # hds.rasterize is suitable for vector types like TriMesh.
            # The aggregator operates on the 'z' vdim of the TriMesh.
            rasterized_mesh = hds.rasterize(trimesh_gv, aggregator=ds_agg.mean('z'), line_width=0)

            # Style the rasterized mesh
            # Set dynamic=False for rasterize if you don't want it to re-rasterize on every zoom/pan
            # However, for trimesh, it's usually better to keep it dynamic or pre-rasterize to a fixed resolution.
            # For interactive dashboards, dynamic=True (default for rasterize) is often fine.
            styled_mesh = rasterized_mesh.opts(
                cmap=cmap_name,
                colorbar=True,
                width=800, height=600, # Adjust as needed
                clim=clim,
                title=plot_title
            )

            # Overlay with a basemap
            # OSM is a common choice. Ensure you have internet connectivity.
            basemap = gv.tile_sources.OSM()

            # Combine basemap and styled mesh
            # The order matters: basemap first, then data overlay
            final_plot = (basemap * styled_mesh).opts(
                active_tools=['wheel_zoom', 'pan'],
                responsive=True, min_height=500 # Make plot responsive
            )
            return final_plot

        except Exception as e:
            import traceback
            tb_str = traceback.format_exc()
            return pn.pane.Alert(f"Error during plotting: {e}\n<pre>{tb_str}</pre>",
                                 alert_type='danger', sizing_mode="stretch_width")

    # --- 5. Layout dashboard ---
    # Using a Panel template for a structured layout
    template = pn.template.VanillaTemplate(title="Geospatial Data Dashboard")
    # Or try: FastListTemplate, MaterialTemplate

    sidebar_widgets = pn.Column(
        "### Controls", # Title for the sidebar section
        variable_select,
        time_select,
        level_select,
        cmap_select,
        sizing_mode='stretch_width' # Widgets stretch to sidebar width
    )
    template.sidebar.append(sidebar_widgets)

    # The main area will contain the plot
    # The create_plot function is already bound, so it will update automatically
    template.main.append(pn.Row(create_plot)) # Wrap in Row for alignment/sizing

    return template


# --- Example Usage ---
def create_sample_xarray_dataset():
    """Creates a sample xarray dataset for demonstration."""
    num_nodes = 150
    lons = np.random.uniform(-10, 0, num_nodes)  # Example: Gulf of Mexico area
    lats = np.random.uniform(20, 30, num_nodes)

    num_triangles = 250
    # Ensure triangle vertices are valid 0-based indices for the nodes
    triangles_data = np.random.randint(0, num_nodes, size=(num_triangles, 3))
    # Ensure no degenerate triangles (all vertices same) for this example
    for i in range(num_triangles):
        while len(set(triangles_data[i,:])) < 3:
            triangles_data[i,:] = np.random.randint(0, num_nodes, size=3)


    times_data = pd.to_datetime(['2024-01-01T00:00:00', '2024-01-01T06:00:00', '2024-01-01T12:00:00'])
    levels_data = np.array([0.0, 5.0, 10.0]) # e.g., depth in meters

    # Data variables
    # (node)
    bathymetry_data = np.random.rand(num_nodes) * 50 + 5 # Positive values for depth
    # (time, node)
    surface_elevation_data = np.random.randn(len(times_data), num_nodes) * 0.5
    # (time, node, level)
    temperature_data = 15 + 10 * np.random.rand(len(times_data), num_nodes, len(levels_data)) - (levels_data[np.newaxis, np.newaxis, :] / 2)
    # (node, level) - another type of variable
    salinity_profile_data = 30 + 5 * np.random.rand(num_nodes, len(levels_data))


    ds = xr.Dataset(
        {
            'longitude': (('node',), lons, {'units': 'degrees_east', 'standard_name': 'longitude'}),
            'latitude': (('node',), lats, {'units': 'degrees_north', 'standard_name': 'latitude'}),
            'connectivity': (('triangle', 'vertex'), triangles_data, {'cf_role': 'face_node_connectivity', 'start_index': 0}),
            'surface_elevation': (('time', 'node'), surface_elevation_data, {'units': 'm', 'standard_name': 'sea_surface_height_above_geoid'}),
            'temperature': (('time', 'node', 'level'), temperature_data, {'units': 'Celsius', 'standard_name': 'sea_water_temperature'}),
            'bathymetry': (('node',), bathymetry_data, {'units': 'm', 'standard_name': 'sea_floor_depth_below_geoid'}),
            'salinity_profile': (('node', 'level'), salinity_profile_data, {'units': 'psu'})
        },
        coords={
            'node': np.arange(num_nodes),
            'triangle': np.arange(num_triangles),
            'vertex': np.arange(3),
            'time': times_data,
            'level': (('level',), levels_data, {'units': 'm', 'positive': 'down'}),
        }
    )
    # Add some global attributes
    ds.attrs['title'] = "Sample Triangular Mesh Model Output"
    ds.attrs['Conventions'] = "CF-1.8"
    return ds

if __name__ == '__main__':
    # This part will run if the script is executed directly
    # In a Jupyter notebook, you would call .show() or .servable() on the dashboard

    # Create sample data
    sample_ds = create_sample_xarray_dataset()

    # Generate the dashboard
    # You can customize the names if your dataset uses different conventions:
    # e.g., dashboard = create_geospatial_dashboard(sample_ds, node_dim_names=['my_node_dim'], ...)
    dashboard = create_geospatial_dashboard(sample_ds)

    # To display in a script, you might need to serve it:
    # dashboard.show() # Opens in a browser tab if server extension is available
    # Or, if you are in a context that can display Panel objects (like Jupyter or a Panel server app)
    # For example, to make it servable with `panel serve your_script.py`
    dashboard.servable(title="Triangular Mesh Data Viewer")

    # If running in a plain Python script and want to launch a server instance:
    # This requires Bokeh server to be available.
    # server_thread = dashboard.show(threaded=True)
    # print("Dashboard is being served. Press Ctrl+C to stop.")
    # try:
    #     import time
    #     while True: time.sleep(1)
    # except KeyboardInterrupt:
    #     print("Stopping server...")
    #     server_thread.stop() # This might not be the exact method for VanillaTemplate's show() thread.
    #     # For direct pn.serve:
    #     # server = pn.serve(dashboard, port=0, show=True, threaded=True) # port=0 finds a free port
    #     # server.stop()

    # For testing, just printing that it's ready (since we can't 'show' in this environment directly)
    print("Sample dataset and dashboard function are ready.")
    print("To view the dashboard, run this script with `panel serve your_script_name.py` "
          "or integrate into a Jupyter Notebook and call `dashboard` or `dashboard.show()`.")
Seems quite close, but got back:
@pn.bind(variable_name=variable_select, time_key=time_select,
    169          level_key=level_select, cmap_name=cmap_select)
    170 def create_plot(variable_name, time_key, level_key, cmap_name):
    171     if not variable_name:
    172         return pn.pane.Markdown("### Please select a data variable.", sizing_mode="stretch_both")

TypeError: bind() missing 1 required positional argument: 'function'
It’s using pn.bind as a decorator which isn’t correct.
You can toggle Ground output (or something similar i.e. search) in aistudio, or if you’re using Gemini webpage, I think you can ask it to search online for the latest docs first.
Alternatively, you can manually paste the docs
Thanks @ahuang11 — I’ll let you know here if I’m successful!
The key problem I encounter with using it to build Panel apps is that the LLM either
param.watch over pn.bindpn.bind properlyThese primarily stem from the LLMs being trained on outdated docs (old cutoff date, but maybe it changed recently)
So to patch these issues, I think providing links to the best practices or asking the LLM to look up the latest docs is good.The other thing is providing a few good examples, and I would structure it like how Lumen does it:
{general instructions} {a couple good examples and/or counter examples} {context}
The other thing is taking a role, i.e. I like to mention “think like John Carmack” if working with SQL or optimization problem. Finally, if you like the docs of another package, ask it to mimic it.
Okay, I’m pretty pumped because this worked:
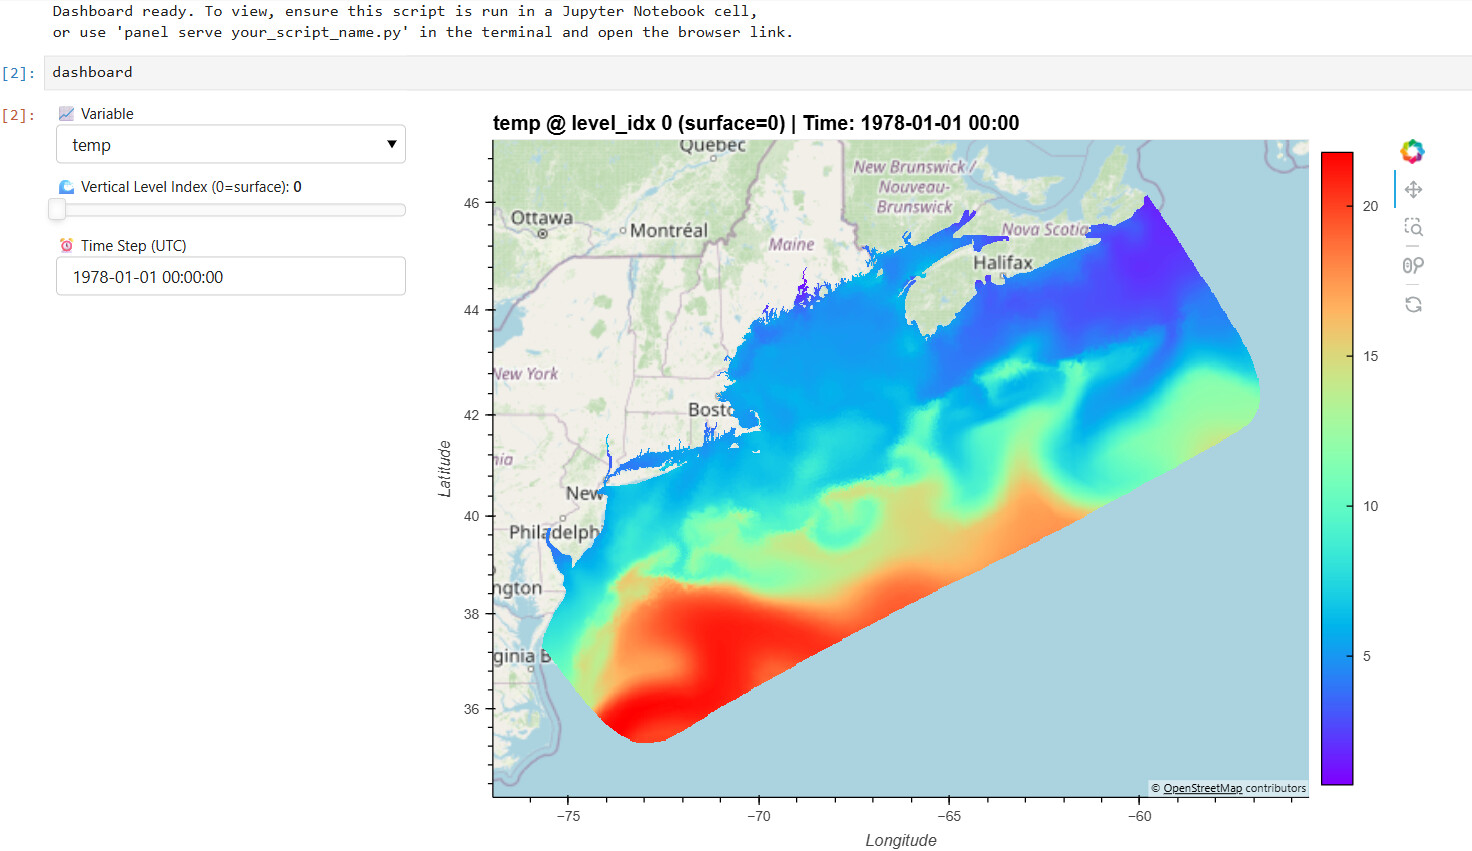
I fed Gemini (2.5 Pro) some python code( fvcom_gom3_explore.py) that used TriMesh/Dshade to visualize some data on a triangular mesh ocean model and used the prompt: “Add Panel widgets to control the xarray variable, the vertical level and the time step to this python code” and then added “use a calendar datetime picker widget instead of the select widget for time” and it generated this code which worked without changes:
https://nbviewer.org/gist/rsignell/d6226361aff692916e5c606eb2ab9204
Here’s a snapshot of the dashboard:
That is so cool!