Dear panel users,
I managed to get a coupled plot of a map and a time series plot using hv.interactive. But, I would like to get a loading indicator (for each plot) until the plot shows up since I use huge data sets.
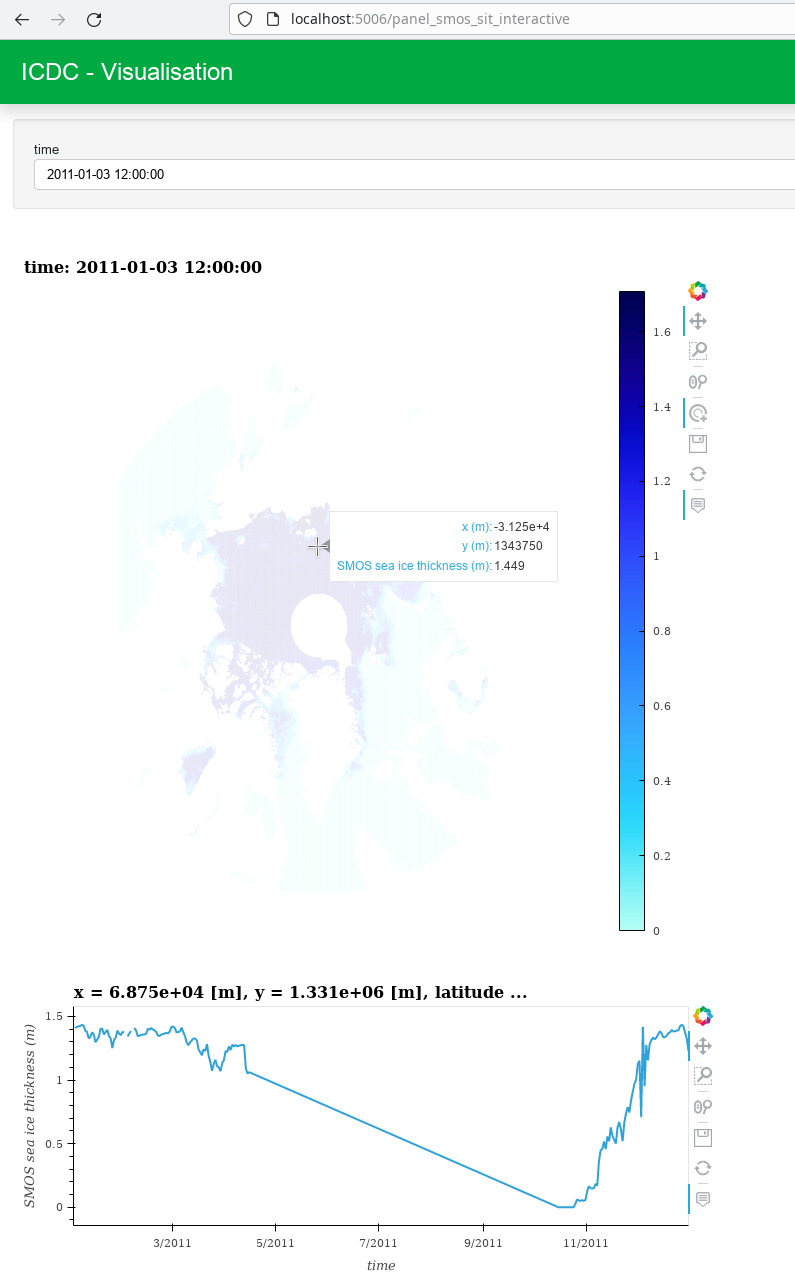
Is it possible with hv.interactive? I did not find any examples.
Here is my code:
import numpy as np
np.float = float
import panel as pn
import xarray as xr
import geoviews as gv
import holoviews as hv
from geoviews import dim, opts
from cartopy import crs as ccrs
import geoviews.feature as gf
import hvplot.xarray  # noqa
import datetime as dt
from bokeh.models import TapTool,BoxZoomTool, ResetTool

pn.extension(sizing_mode="stretch_width", template="bootstrap", loading_spinner='dots', loading_color='#00aa41')
pn.state.template.param.update(site="ICDC", title="Visualisation")

dataset = xr.open_dataset('https://icdc.cen.uni-hamburg.de/thredds/dodsC/smos_icethickness_2011')
# units are in km! > coastlines did not show up
dataset["x"]=dataset["x"]*1000
dataset["y"]=dataset["y"]*1000
dataset["x"].attrs={"units":"m"}
dataset["y"].attrs={"units":"m"}
mapplot, select = dataset["sea_ice_thickness"].hvplot.quadmesh('x','y', widgets={'time':pn.widgets.Select}, tools=[TapTool()], crs = ccrs.NorthPolarStereo(central_longitude=-45, true_scale_latitude=70), projection = ccrs.NorthPolarStereo(central_longitude=-45, true_scale_latitude=70), geo=True, height=700, width=700)
stream = hv.streams.Tap(source=mapplot.object)
tsplot = dataset["sea_ice_thickness"].interactive.sel(x=stream.param.x, y=stream.param.y, method="nearest").hvplot.line()
map_pane = pn.Column(select, pn.panel(mapplot, loading_indicator=True), pn.panel(tsplot, loading_indicator=True)) # pn.panel: plot result OR progress wheel
map_pane.servable()
I know how to get a loading indicator with pn.bind and pn.panel(boundplot, loading_indicator=True), but I did not manage to get the interconnection between the map plot and the time series plot running by clicking into the map (using the Tap Tool) with pn.bind. Could you give me a hint?
Thanks a lot!