Dear All,
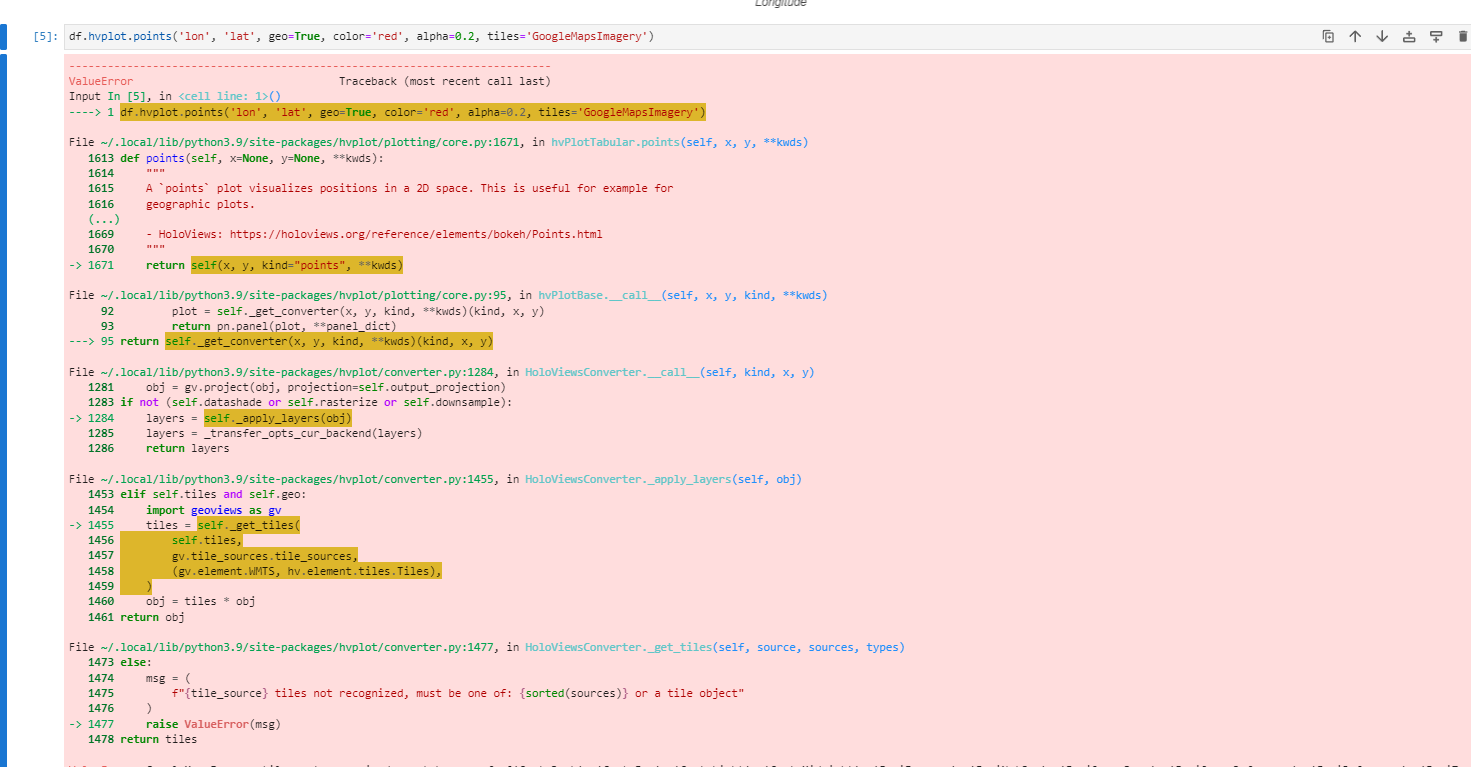
I try to use local tile in the server however there is an error:
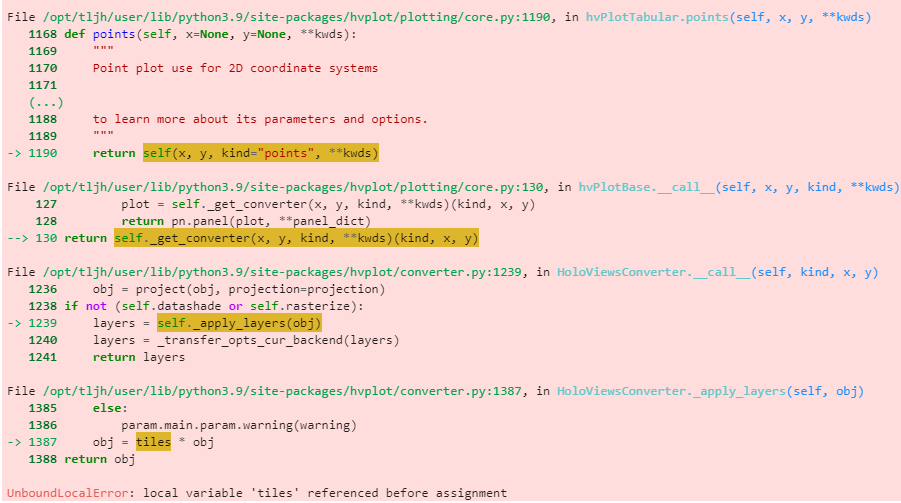
how I can fix the problem.
my code is :df.hvplot.points(‘lon’, ‘lat’, geo=True,
tiles='mylocaltileserver).opts(width=600, height=550)
thanks
Dear All,
I try to use local tile in the server however there is an error:
how I can fix the problem.
my code is :df.hvplot.points(‘lon’, ‘lat’, geo=True,
tiles='mylocaltileserver).opts(width=600, height=550)
thanks
Are you using hvplot 0.9.0?
I think a workaround is to drop tiles=… and use geoviews like python - How to use custom tile sources (Bing, Google) in geoviews / holoviews? - Geographic Information Systems Stack Exchange
hi @ahuang11 , thanks for your suggestion. I am using hvplot 0.8 but I have upgrade to that version (0.9.0) the problem still the same.
I just try to use what tile used in your link but unfortunately still not work before use my localtile server
code as below
I meant to instantiate WMTS like:
from geoviews.element import WMTS
df.hvplot() * WMTS("your/local/server")
Hi @rh1,
Do you mind opening an issue on Github? I’m not sure at the moment to which extent hvPlot supports setting tiles to a local server. But the traceback you report clearly shows there is something not handled correctly, an UnboundLocalError should never happen.
hi @maximlt , I try to reproduce my previous script but unfortunately I didn’t get the same error.
only value error because tiles not recognized.
Probably because I upgrade my hvplot from 0.8 to 0.9.
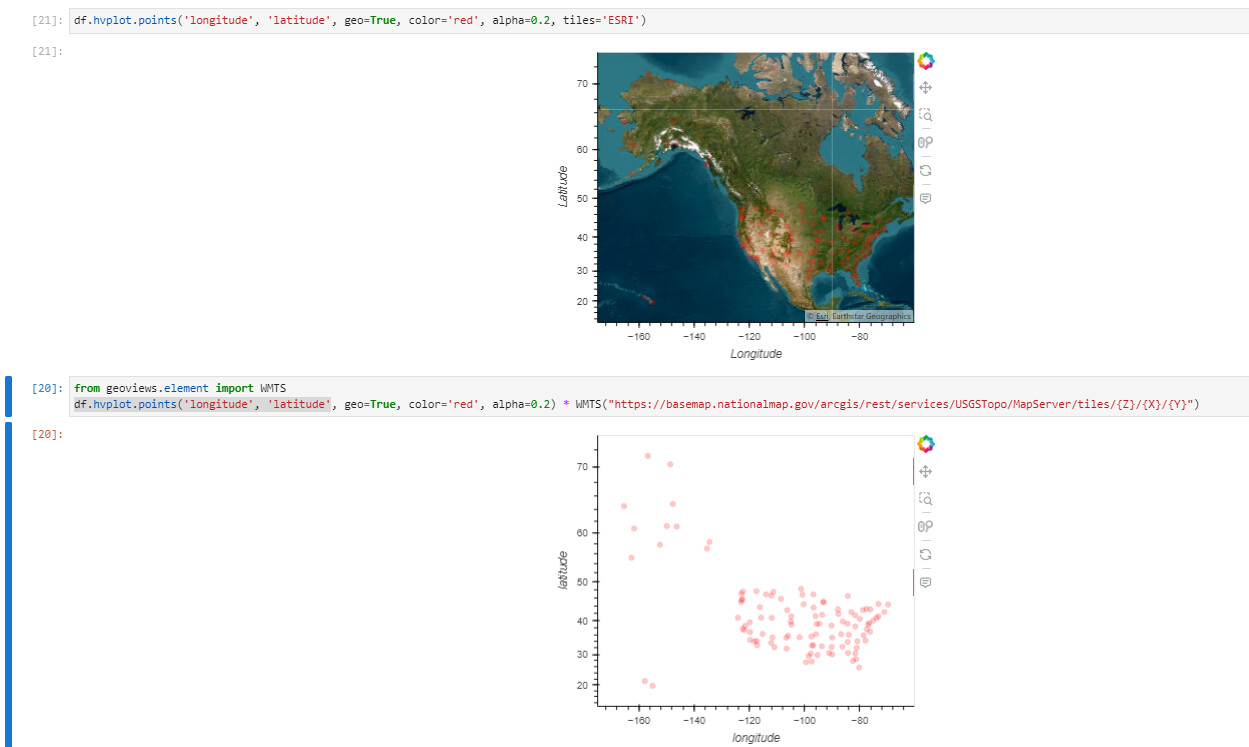
I use workaround from @ahuang11 and there is no error anymore but there are empty tiles/basemap there (using server from "USGSTopo (MapServer) which is the same configuration with my local server)
hi @ahuang11 . thanks for your suggestion.
I try to use tile server from nationalmap which is quite same with my local server tile, but still no basemap appear in the hvplot
Could you please also post the code? As a minimal, reproducible example (MRE)?
In general, a complete script only with the essential code, which can be copied/pasted and immediately run as-is with no modifications. This is much more useful than snippets.
Hi @Hoxbro ,
below is more detail:
sample data can be downloaded from:
https://raw.githubusercontent.com/opengeos/leafmap/master/examples/data/us_cities.csv
code:
import pandas as pd
import holoviews as hv
from holoviews import opts
import hvplot.pandas # noqa
import hvplot.xarray # noqa
hv.extension(‘bokeh’)
df=pd.read_csv(‘us_cities.csv’)
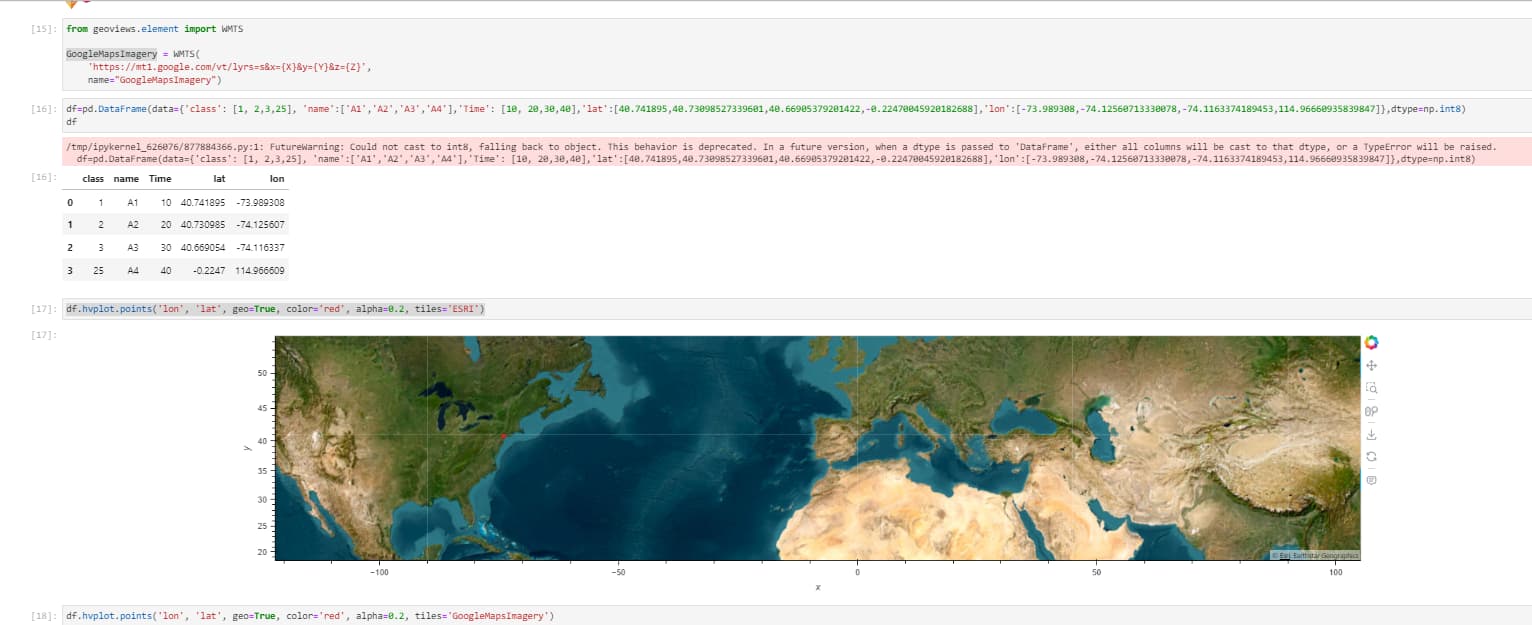
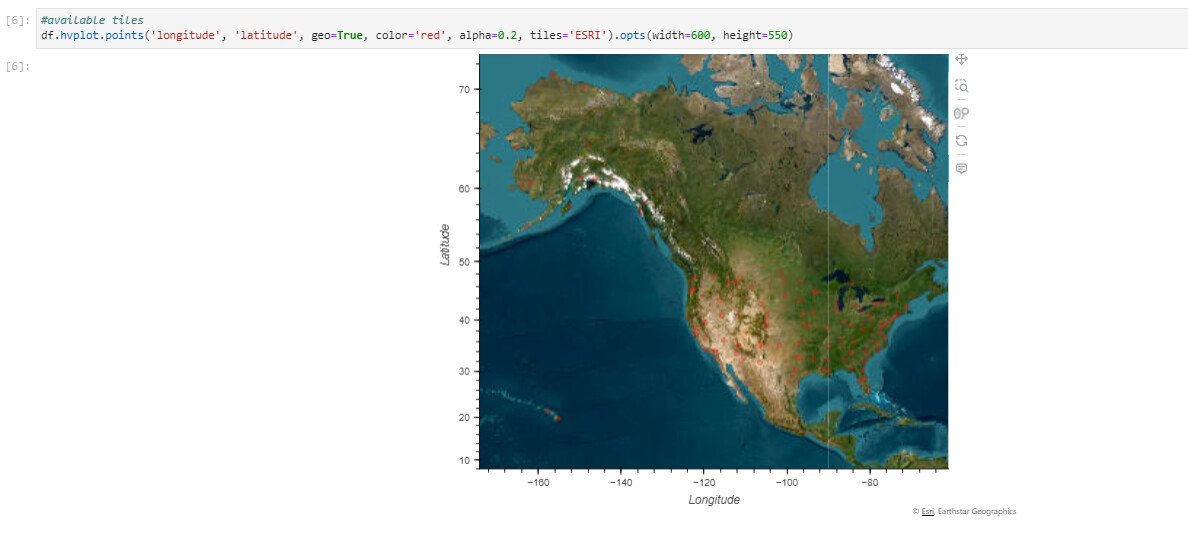
#available tiles and working tiles
df.hvplot.points(‘longitude’, ‘latitude’, geo=True, color=‘red’, alpha=0.2, tiles=‘ESRI’)
#custom tile or local tile
from geoviews.element import WMTS
df.hvplot.points(‘longitude’, ‘latitude’, geo=True, color=‘red’, alpha=0.2) * WMTS(“USGSTopo (MapServer)”)
Would check the browser console log (F12) to see if you see any errors.
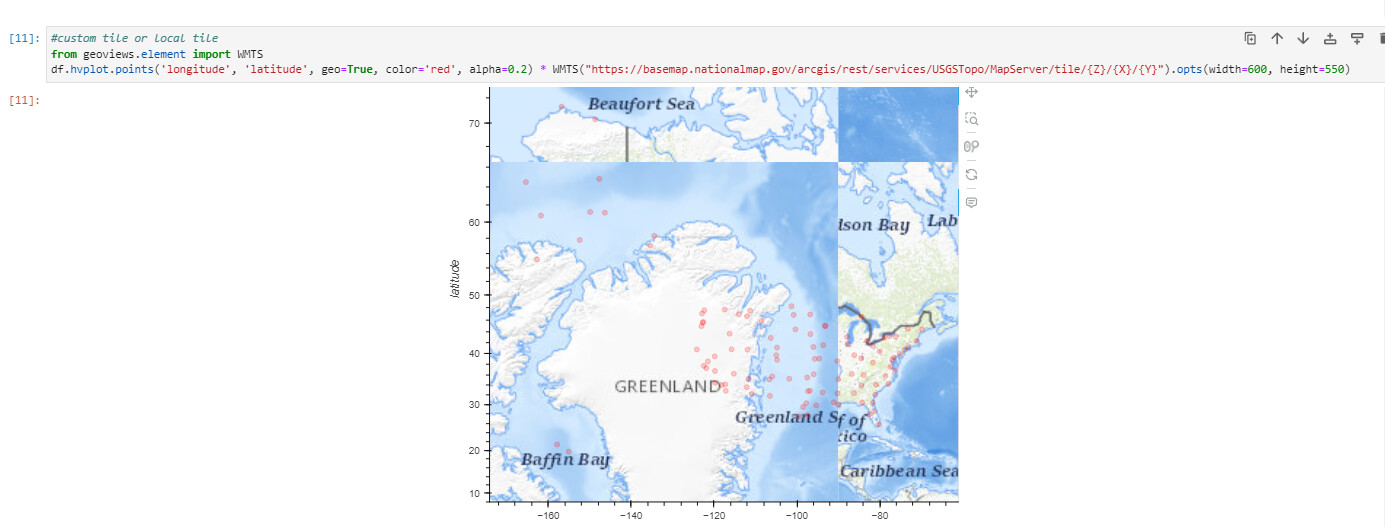
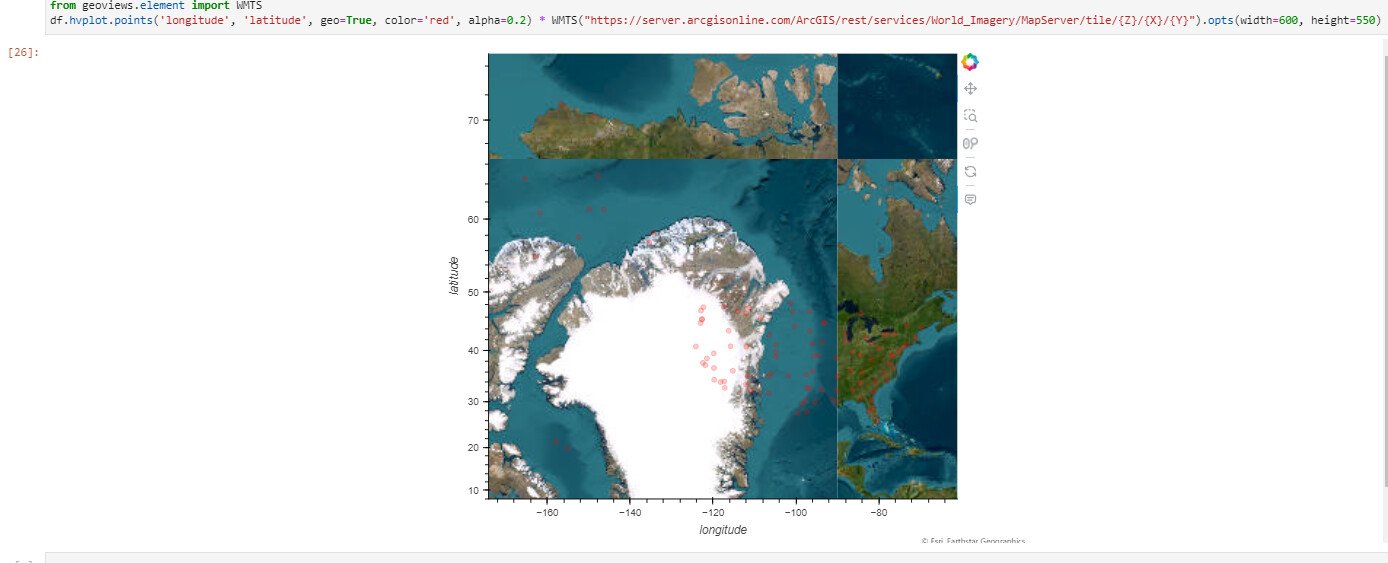
Hi @ahuang11 , there is nothing error related with the tile. However I try to change address of WMTS, now it showed the tile but in the wrong positions:)
Maybe redefine as z y x?
thanks @ahuang11 . solved with change the order to z,y,x.
regards