ea42gh
April 10, 2022, 7:15pm
1
I am plotting errors as small as 1e-18 on semilog axes.
I am getting the warningLogarithmic axis range encountered value less than or equal to zero, please supply explicit lower-bound
I thought all I had to do was
ydim = hv.Dimension('y', range=(1e-18, math.nan))
hv.Curve(data,"x", ydim).opts(logy=True)
but no…
What’s the simplest fix?
ea42gh
April 28, 2022, 8:45pm
2
I ended up defining a clamp function:
def clamp(A,val):
    return [max(a,val) for a in A]
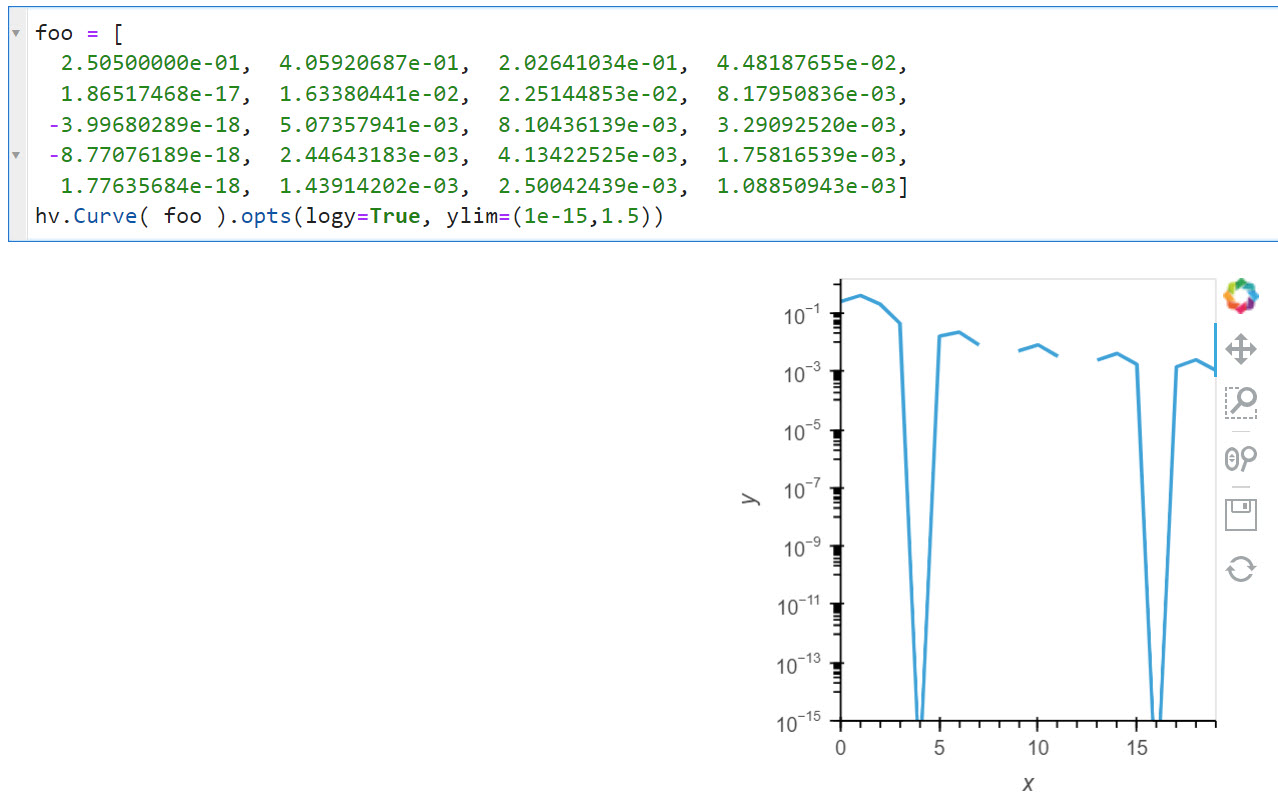
applied to data. This also fixes a plotting problem with logy axes seen below
Saw your comment about the dropouts on Gitter, and if you haven’t already solved it, the dropouts are because of the negative values in your data. Try to take the data’s absolute value, and the dropouts will disappear.
foo = [ 2.50500000e-01, 4.05920687e-01, 2.02641034e-01, 4.48187655e-02, 1.86517468e-17, 1.63380441e-02, 2.25144853e-02, 8.17950836e-03, -3.99680289e-18, 5.07357941e-03, 8.10436139e-03, 3.29092520e-03, -8.77076189e-18, 2.44643183e-03, 4.13422525e-03, 1.75816539e-03, 1.77635684e-18, 1.43914202e-03, 2.50042439e-03, 1.08850943e-03]
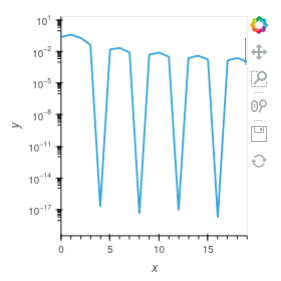
hv.Curve( np.abs(foo) ).opts(logy=True)
Ouch! I had omitted computing an absolute value in my code! Thank you @Hoxbro
1 Like