How could I change the following to map the marker style to the “m” variable (rather than the multiple y series)?
import xarray as xr
import numpy as np
import hvplot.xarray

ds = xr.Dataset({
    "x": np.arange(10),
    "y0": ("x", np.random.random(10)),
    "y1": ("x", np.random.random(10)),
    "m": ("x", [0, 1]*5)
})
ds.hvplot.scatter(y=["y0", "y1"], marker=hv.Cycle(['s', '+']))
I thought I might pass vdims to Holoviews for use in styling , but vdims do not seem to pass through.
You should be able to use dim transforms
import xarray as xr
import numpy as np
import hvplot.xarray
import holoviews as hv

ds = xr.Dataset({
    "x": np.arange(10),
    "y0": ("x", np.random.random(10)),
    "y1": ("x", np.random.random(10)),
    "m": ("x", [0, 1]*5)
})
ds.hvplot.scatter(y=["y0", "y1"], marker=hv.dim('m').categorize({0: 'triangle', 1: 'circle'}))
1 Like
philippjfr:
import xarray as xr
import numpy as np
import hvplot.xarray
import holoviews as hv

ds = xr.Dataset({
    "x": np.arange(10),
    "y0": ("x", np.random.random(10)),
    "y1": ("x", np.random.random(10)),
    "m": ("x", [0, 1]*5)
})
ds.hvplot.scatter(y=["y0", "y1"], marker=hv.dim('m').categorize({0: 'triangle', 1: 'circle'}))
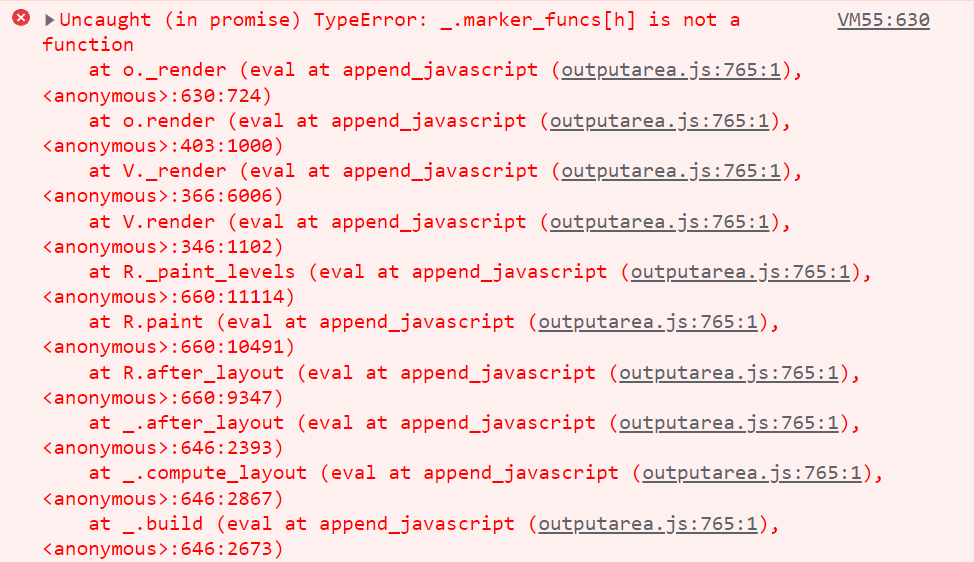
This works however using {0:‘^’, 1:‘o’} doesn’t work (blank plot). Using marker = ‘^’ or marker =‘o’ atleast displays without errors.