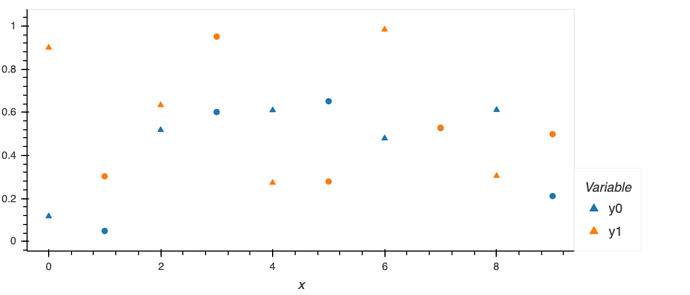
You should be able to use dim transforms:
import xarray as xr
import numpy as np
import hvplot.xarray
import holoviews as hv

ds = xr.Dataset({
    "x": np.arange(10),
    "y0": ("x", np.random.random(10)),
    "y1": ("x", np.random.random(10)),
    "m": ("x", [0, 1]*5)
})
ds.hvplot.scatter(y=["y0", "y1"], marker=hv.dim('m').categorize({0: 'triangle', 1: 'circle'}))
