I primarily work with satellite data that generates vertical profiles such that the data are collected in time and altitude with an associated latitude and longitude. I process the data into xarray with dimensions of time and Altitude. latitude and longitude are data_vars specified as coordinates along with other measurement-descriptive parameters such that I end up with a DataArray in the DataSet that looks something like
<xarray.DataArray 'Ozone_ao3' (time: 27691, Altitude: 200)>
dask.array<where, shape=(27691, 200), dtype=float32, chunksize=(938, 200), chunktype=numpy.ndarray>
Coordinates:
  * Altitude          (Altitude) float32 0.5 1.0 1.5 2.0 ... 99.0 99.5 100.0
    event_id          (time) int32 dask.array<chunksize=(617,), meta=np.ndarray>
    latitude          (time) float32 dask.array<chunksize=(617,), meta=np.ndarray>
    longitude         (time) float32 dask.array<chunksize=(617,), meta=np.ndarray>
    GRAM95_Version    (time) float32 dask.array<chunksize=(617,), meta=np.ndarray>
    Met_Version       (time) float32 dask.array<chunksize=(617,), meta=np.ndarray>
    sc_evt_type       (time) int32 dask.array<chunksize=(617,), meta=np.ndarray>
    gnd_evt_type      (time) int32 dask.array<chunksize=(617,), meta=np.ndarray>
    BetaAngle_Solar   (time) float32 dask.array<chunksize=(617,), meta=np.ndarray>
    Ephemeris_Source  (time) int32 dask.array<chunksize=(617,), meta=np.ndarray>
    met_source        (time) int32 dask.array<chunksize=(617,), meta=np.ndarray>
  * time              (time) datetime64[ns] 2017-06-07T16:03:42 ... 2020-08-3...
My ultimate goal is to create an interactive map where regions can be selected and the altitude profiles summarized over the selected time period and geographic area. The basic map is already easy to make by taking the DataArray object and requesting .plot.scatter('longitude', 'latitude') to generate something like this with a simulated selection box and summary profile like this
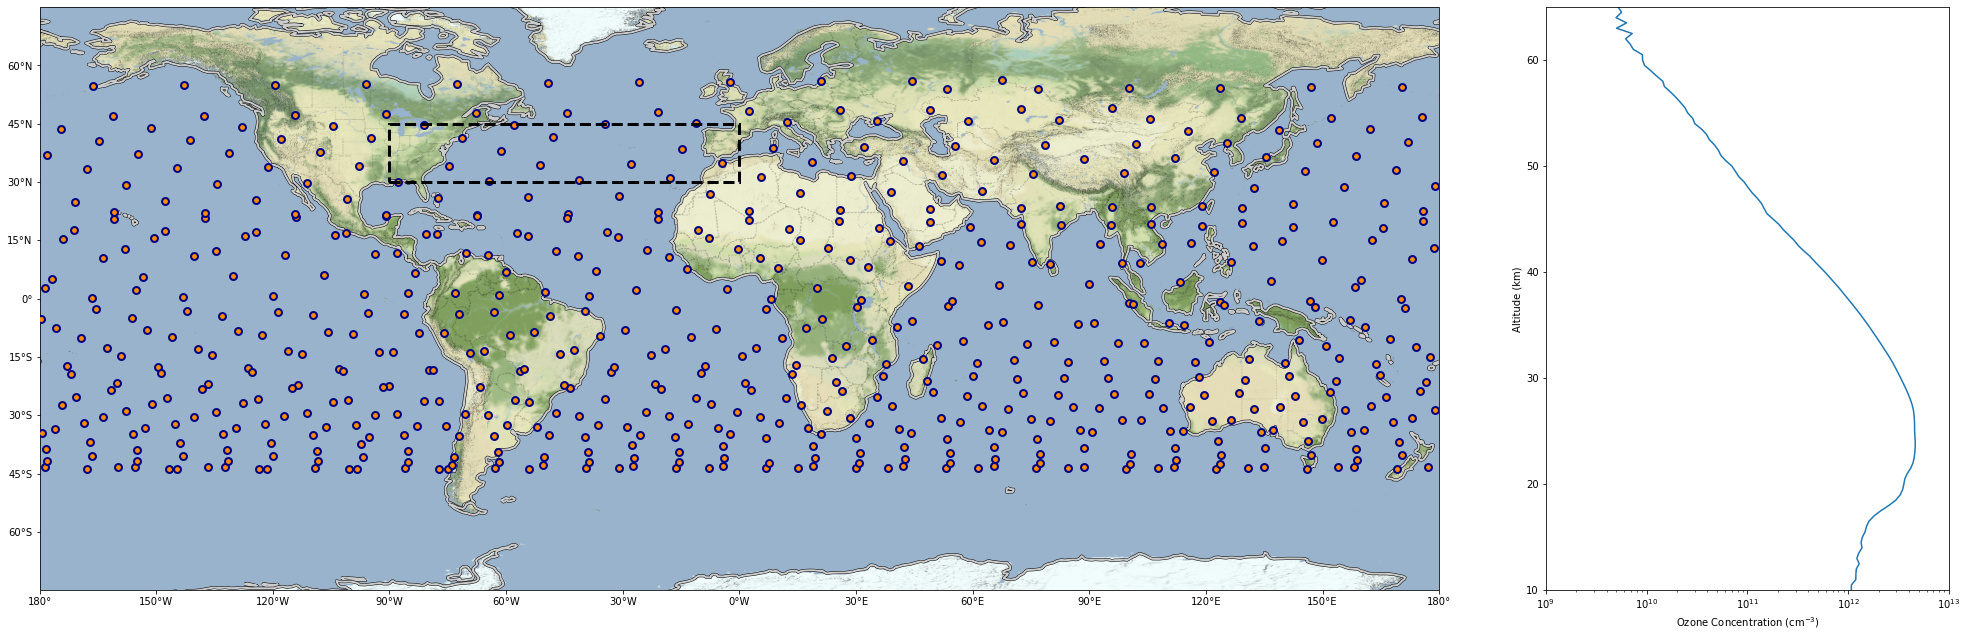
where the right plot is now the average profile of atmospheric ozone concentration in the selected region.
The problem I am encountering is that, if I am understanding hvplot/geoviews correctly, the structure is expected to have dimensions of the coordinates to be plotted, and it is insufficient that they exist as variables. For example, if I attempt .hvplot.points('longitude', 'latitude', geo=True) on my DataArray I am met with an extremely long error sequence
---------------------------------------------------------------------------
IndexError                                Traceback (most recent call last)
~/.conda/envs/analysis/lib/python3.8/site-packages/IPython/core/formatters.py in __call__(self, obj, include, exclude)
    968
    969             if method is not None:
--> 970                 return method(include=include, exclude=exclude)
    971             return None
    972         else:

~/.conda/envs/analysis/lib/python3.8/site-packages/holoviews/core/dimension.py in _repr_mimebundle_(self, include, exclude)
   1310         combined and returned.
   1311         """
-> 1312         return Store.render(self)
   1313
   1314

~/.conda/envs/analysis/lib/python3.8/site-packages/holoviews/core/options.py in render(cls, obj)
   1393         data, metadata = {}, {}
   1394         for hook in hooks:
-> 1395             ret = hook(obj)
   1396             if ret is None:
   1397                 continue

~/.conda/envs/analysis/lib/python3.8/site-packages/holoviews/ipython/display_hooks.py in pprint_display(obj)
    280     if not ip.display_formatter.formatters['text/plain'].pprint:
    281         return None
--> 282     return display(obj, raw_output=True)
    283
    284

~/.conda/envs/analysis/lib/python3.8/site-packages/holoviews/ipython/display_hooks.py in display(obj, raw_output, **kwargs)
    250     elif isinstance(obj, (CompositeOverlay, ViewableElement)):
    251         with option_state(obj):
--> 252             output = element_display(obj)
    253     elif isinstance(obj, (Layout, NdLayout, AdjointLayout)):
    254         with option_state(obj):

~/.conda/envs/analysis/lib/python3.8/site-packages/holoviews/ipython/display_hooks.py in wrapped(element)
    144         try:
    145             max_frames = OutputSettings.options['max_frames']
--> 146             mimebundle = fn(element, max_frames=max_frames)
    147             if mimebundle is None:
    148                 return {}, {}

~/.conda/envs/analysis/lib/python3.8/site-packages/holoviews/ipython/display_hooks.py in element_display(element, max_frames)
    190         return None
    191
--> 192     return render(element)
    193
    194

~/.conda/envs/analysis/lib/python3.8/site-packages/holoviews/ipython/display_hooks.py in render(obj, **kwargs)
     66         renderer = renderer.instance(fig='png')
     67
---> 68     return renderer.components(obj, **kwargs)
     69
     70

~/.conda/envs/analysis/lib/python3.8/site-packages/holoviews/plotting/renderer.py in components(self, obj, fmt, comm, **kwargs)
    386                 doc = Document()
    387                 with config.set(embed=embed):
--> 388                     model = plot.layout._render_model(doc, comm)
    389                 if embed:
    390                     return render_model(model, comm)

~/.conda/envs/analysis/lib/python3.8/site-packages/panel/viewable.py in _render_model(self, doc, comm)
    416         if comm is None:
    417             comm = state._comm_manager.get_server_comm()
--> 418         model = self.get_root(doc, comm)
    419
    420         if config.embed:

~/.conda/envs/analysis/lib/python3.8/site-packages/panel/viewable.py in get_root(self, doc, comm)
    645         """
    646         doc = doc or _curdoc()
--> 647         root = self._get_model(doc, comm=comm)
    648         self._preprocess(root)
    649         ref = root.ref['id']

~/.conda/envs/analysis/lib/python3.8/site-packages/panel/layout.py in _get_model(self, doc, root, parent, comm)
    118         if root is None:
    119             root = model
--> 120         objects = self._get_objects(model, [], doc, root, comm)
    121         props = dict(self._init_properties(), objects=objects)
    122         model.update(**self._process_param_change(props))

~/.conda/envs/analysis/lib/python3.8/site-packages/panel/layout.py in _get_objects(self, model, old_objects, doc, root, comm)
    108             else:
    109                 try:
--> 110                     child = pane._get_model(doc, root, model, comm)
    111                 except RerenderError:
    112                     return self._get_objects(model, current_objects[:i], doc, root, comm)

~/.conda/envs/analysis/lib/python3.8/site-packages/panel/pane/holoviews.py in _get_model(self, doc, root, parent, comm)
    225             plot = self.object
    226         else:
--> 227             plot = self._render(doc, comm, root)
    228
    229         plot.pane = self

~/.conda/envs/analysis/lib/python3.8/site-packages/panel/pane/holoviews.py in _render(self, doc, comm, root)
    284             kwargs = {}
    285
--> 286         return renderer.get_plot(self.object, **kwargs)
    287
    288     def _cleanup(self, root):

~/.conda/envs/analysis/lib/python3.8/site-packages/holoviews/plotting/bokeh/renderer.py in get_plot(self_or_cls, obj, doc, renderer, **kwargs)
     71         combining the bokeh model with another plot.
     72         """
---> 73         plot = super(BokehRenderer, self_or_cls).get_plot(obj, doc, renderer, **kwargs)
     74         if plot.document is None:
     75             plot.document = Document() if self_or_cls.notebook_context else curdoc()

~/.conda/envs/analysis/lib/python3.8/site-packages/holoviews/plotting/renderer.py in get_plot(self_or_cls, obj, doc, renderer, comm, **kwargs)
    235             init_key = tuple(v if d is None else d for v, d in
    236                              zip(plot.keys[0], defaults))
--> 237             plot.update(init_key)
    238         else:
    239             plot = obj

~/.conda/envs/analysis/lib/python3.8/site-packages/holoviews/plotting/plot.py in update(self, key)
    898     def update(self, key):
    899         if len(self) == 1 and ((key == 0) or (key == self.keys[0])) and not self.drawn:
--> 900             return self.initialize_plot()
    901         item = self.__getitem__(key)
    902         self.traverse(lambda x: setattr(x, '_updated', True))

~/.conda/envs/analysis/lib/python3.8/site-packages/geoviews/plotting/bokeh/plot.py in initialize_plot(self, ranges, plot, plots, source)
    107     def initialize_plot(self, ranges=None, plot=None, plots=None, source=None):
    108         opts = {} if isinstance(self, HvOverlayPlot) else {'source': source}
--> 109         fig = super(GeoPlot, self).initialize_plot(ranges, plot, plots, **opts)
    110         if self.geographic and self.show_bounds and not self.overlaid:
    111             from . import GeoShapePlot

~/.conda/envs/analysis/lib/python3.8/site-packages/holoviews/plotting/bokeh/element.py in initialize_plot(self, ranges, plot, plots, source)
   1337         self.handles['plot'] = plot
   1338
-> 1339         self._init_glyphs(plot, element, ranges, source)
   1340         if not self.overlaid:
   1341             self._update_plot(key, plot, style_element)

~/.conda/envs/analysis/lib/python3.8/site-packages/holoviews/plotting/bokeh/element.py in _init_glyphs(self, plot, element, ranges, source)
   1281         else:
   1282             style = self.style[self.cyclic_index]
-> 1283             data, mapping, style = self.get_data(element, ranges, style)
   1284             current_id = element._plot_id
   1285

~/.conda/envs/analysis/lib/python3.8/site-packages/geoviews/plotting/bokeh/plot.py in get_data(self, element, ranges, style)
    162     def get_data(self, element, ranges, style):
    163         if self._project_operation and self.geographic:
--> 164             element = self._project_operation(element, projection=self.projection)
    165         return super(GeoPlot, self).get_data(element, ranges, style)
    166

~/.conda/envs/analysis/lib/python3.8/site-packages/param/parameterized.py in __new__(class_, *args, **params)
   2810         inst = class_.instance()
   2811         inst.param._set_name(class_.__name__)
-> 2812         return inst.__call__(*args,**params)
   2813
   2814     def __call__(self,*args,**kw):

~/.conda/envs/analysis/lib/python3.8/site-packages/holoviews/core/operation.py in __call__(self, element, **kwargs)
    197         kwargs['per_element'] = self._per_element
    198         kwargs['link_dataset'] = self._propagate_dataset
--> 199         return element.apply(self, **kwargs)
    200
    201

~/.conda/envs/analysis/lib/python3.8/site-packages/holoviews/core/accessors.py in pipelined_call(*args, **kwargs)
     43
     44             try:
---> 45                 result = __call__(*args, **kwargs)
     46
     47                 if not in_method:

~/.conda/envs/analysis/lib/python3.8/site-packages/holoviews/core/accessors.py in __call__(self, apply_function, streams, link_inputs, link_dataset, dynamic, per_element, **kwargs)
    202             if hasattr(apply_function, 'dynamic'):
    203                 inner_kwargs['dynamic'] = False
--> 204             new_obj = apply_function(self._obj, **inner_kwargs)
    205             if (link_dataset and isinstance(self._obj, Dataset) and
    206                 isinstance(new_obj, Dataset) and new_obj._dataset is None):

~/.conda/envs/analysis/lib/python3.8/site-packages/holoviews/core/operation.py in __call__(self, element, **kwargs)
    192             elif ((self._per_element and isinstance(element, Element)) or
    193                   (not self._per_element and isinstance(element, ViewableElement))):
--> 194                 return self._apply(element)
    195         elif 'streams' not in kwargs:
    196             kwargs['streams'] = self.p.streams

~/.conda/envs/analysis/lib/python3.8/site-packages/holoviews/core/operation.py in _apply(self, element, key)
    130
    131         element_pipeline = getattr(element, '_pipeline', None)
--> 132         ret = self._process(element, key)
    133
    134         for hook in self._postprocess_hooks:

~/.conda/envs/analysis/lib/python3.8/site-packages/geoviews/operation/projection.py in _process(self, element, key)
     38
     39     def _process(self, element, key=None):
---> 40         return element.map(self._process_element, self.supported_types)
     41
     42

~/.conda/envs/analysis/lib/python3.8/site-packages/holoviews/core/data/__init__.py in pipelined_fn(*args, **kwargs)
    214
    215             try:
--> 216                 result = method_fn(*args, **kwargs)
    217
    218                 op = method_op.instance(

~/.conda/envs/analysis/lib/python3.8/site-packages/holoviews/core/data/__init__.py in map(self, *args, **kwargs)
   1181
   1182     def map(self, *args, **kwargs):
-> 1183         return super(Dataset, self).map(*args, **kwargs)
   1184     map.__doc__ = LabelledData.map.__doc__
   1185

~/.conda/envs/analysis/lib/python3.8/site-packages/holoviews/core/dimension.py in map(self, map_fn, specs, clone)
    703             return deep_mapped
    704         else:
--> 705             return map_fn(self) if applies else self
    706
    707

~/.conda/envs/analysis/lib/python3.8/site-packages/geoviews/operation/projection.py in _process_element(self, element)
    161             return element.clone(crs=self.p.projection)
    162         xdim, ydim = element.dimensions()[:2]
--> 163         xs, ys = (element.dimension_values(i) for i in range(2))
    164         coordinates = self.p.projection.transform_points(element.crs, xs, ys)
    165         mask = np.isfinite(coordinates[:, 0])

~/.conda/envs/analysis/lib/python3.8/site-packages/geoviews/operation/projection.py in <genexpr>(.0)
    161             return element.clone(crs=self.p.projection)
    162         xdim, ydim = element.dimensions()[:2]
--> 163         xs, ys = (element.dimension_values(i) for i in range(2))
    164         coordinates = self.p.projection.transform_points(element.crs, xs, ys)
    165         mask = np.isfinite(coordinates[:, 0])

~/.conda/envs/analysis/lib/python3.8/site-packages/holoviews/core/data/__init__.py in pipelined_fn(*args, **kwargs)
    214
    215             try:
--> 216                 result = method_fn(*args, **kwargs)
    217
    218                 op = method_op.instance(

~/.conda/envs/analysis/lib/python3.8/site-packages/holoviews/core/data/__init__.py in dimension_values(self, dimension, expanded, flat)
   1069         """
   1070         dim = self.get_dimension(dimension, strict=True)
-> 1071         return self.interface.values(self, dim, expanded, flat)
   1072
   1073

~/.conda/envs/analysis/lib/python3.8/site-packages/holoviews/core/data/xarray.py in values(cls, dataset, dim, expanded, flat, compute, keep_index)
    379             return data.T.flatten() if flat and not keep_index else data
    380         elif expanded:
--> 381             data = cls.coords(dataset, dim.name, expanded=True)
    382             return data.T.flatten() if flat else data
    383         else:

~/.conda/envs/analysis/lib/python3.8/site-packages/holoviews/core/data/xarray.py in coords(cls, dataset, dimension, ordered, expanded, edges)
    322                 data = dataset.data[dim]
    323             else:
--> 324                 data = util.expand_grid_coords(dataset, dim)
    325             if edges:
    326                 data = cls._infer_interval_breaks(data, axis=1)

~/.conda/envs/analysis/lib/python3.8/site-packages/holoviews/core/util.py in expand_grid_coords(dataset, dim)
   1942         return array * np.ones_like(example)
   1943     else:
-> 1944         arrays = [dataset.interface.coords(dataset, d.name, True)
   1945                   for d in dataset.kdims]
   1946         idx = dataset.get_dimension_index(dim)

~/.conda/envs/analysis/lib/python3.8/site-packages/holoviews/core/util.py in <listcomp>(.0)
   1942         return array * np.ones_like(example)
   1943     else:
-> 1944         arrays = [dataset.interface.coords(dataset, d.name, True)
   1945                   for d in dataset.kdims]
   1946         idx = dataset.get_dimension_index(dim)

~/.conda/envs/analysis/lib/python3.8/site-packages/holoviews/core/data/xarray.py in coords(cls, dataset, dimension, ordered, expanded, edges)
    332         if ordered and data.shape and np.all(data[1:] < data[:-1]):
    333             data = data[::-1]
--> 334         shape = cls.shape(dataset, True)
    335
    336         if dim in dataset.kdims:

~/.conda/envs/analysis/lib/python3.8/site-packages/holoviews/core/data/xarray.py in shape(cls, dataset, gridded)
     64             array = dataset.data[..., 0]
     65         else:
---> 66             array = dataset.data[dataset.vdims[0].name]
     67         if not gridded:
     68             return (np.product(array.shape, dtype=np.intp), len(dataset.dimensions()))

IndexError: list index out of range
of which I am noticing that the function is walking over dims.
I can generate scatter plots using .hvplot.scatter('longitude', 'latitude') just fine, though that doesn’t work with geographic axes. I’d also prefer not to translate the latitude and longitude coordinates into dimensions, because then I would have incredibly sparse matrices filled with empty values.
The hvPlot and GeoViews examples all illustrate data that are spatially gridded, so any insight on this use case would be appreciated.
My package versions for xarray, geoviews, and hvplot are
| Package | Version |
|---|---|
| xarray | 0.16.0 |
| GeoViews | 1.8.1 |
| hvPlot | 0.6.0 |