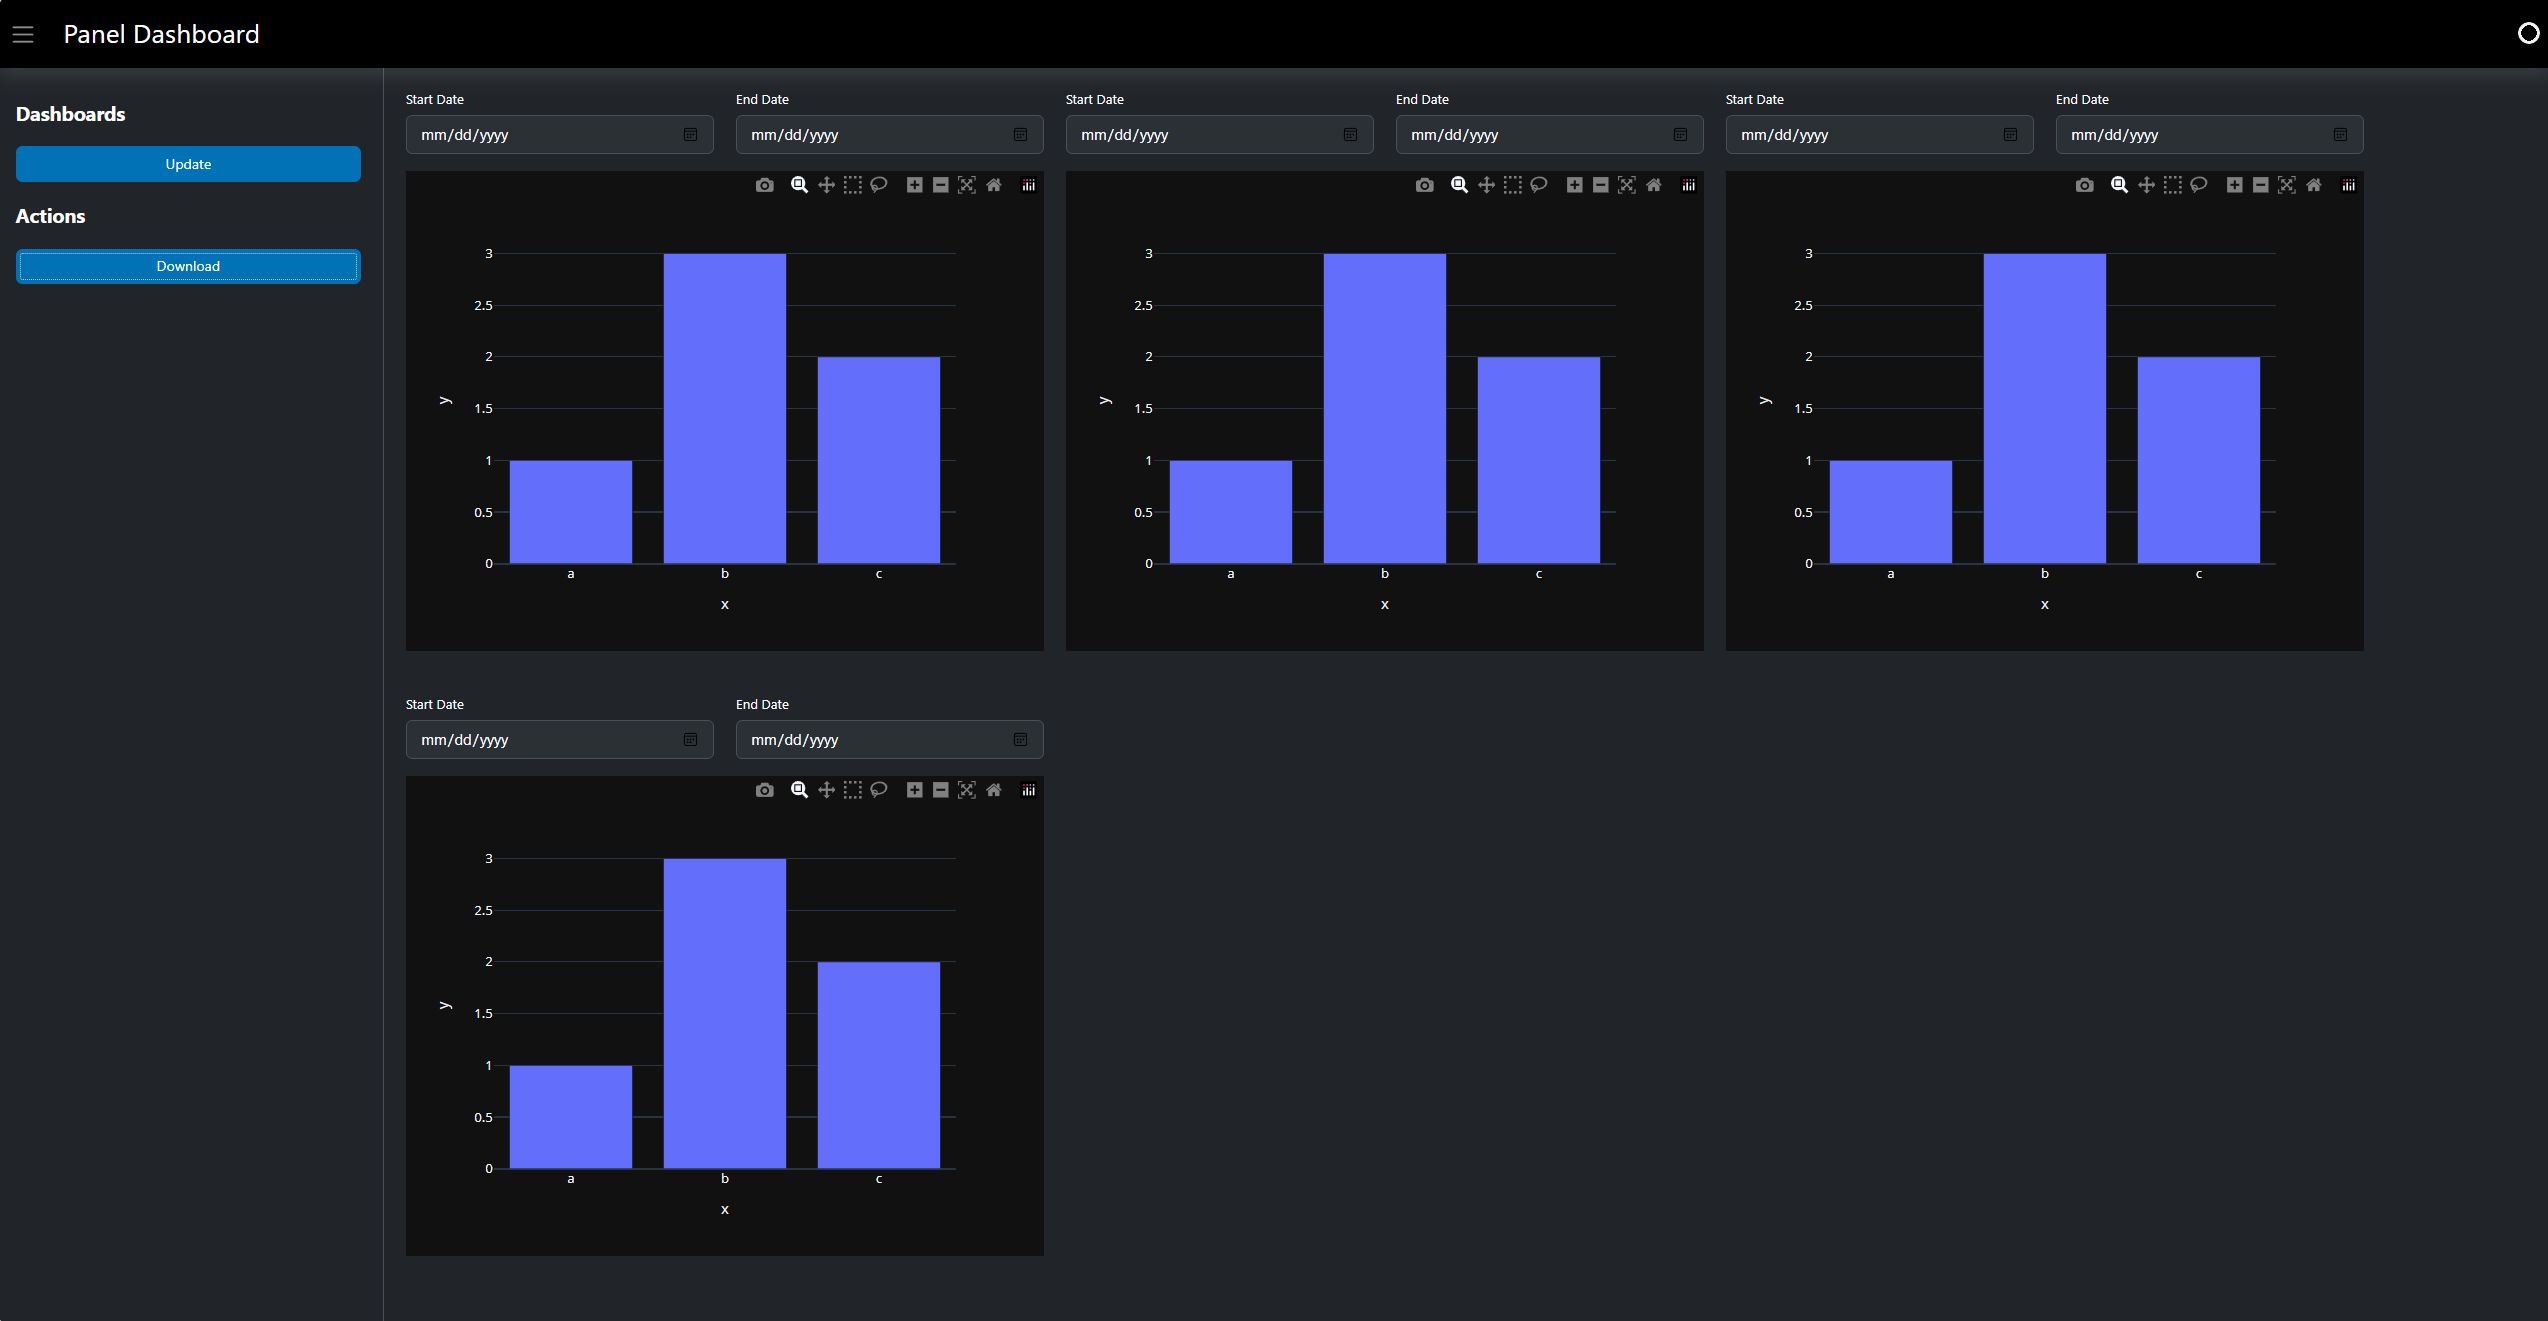
Hello! I am creating a multi-page dashboard (via widgets on sidebar) application, but am having an issue where the right margins of Plotly visualizations create extra unnecessary space and cause the margins to expand. I have two pn.Column side by side, represented by a single pn.Row, which is passed to main when calling pn.template.BootstrapTemplate(...). Each column has rows inside, which represent the individual or grouped plots. The one on the right is the second column in the row. Ultimately, I am looking to have all the plot groupings evenly spaced. In the following image, you can see the large gap down the middle and right sides generated from the margins (image generated via dashboard.show()):
I’ve replicated the issue across different browsers and when resizing the window. I’ve tried several things to troubleshoot this issue. I’ve just about bruteforced manipulation of the Plotly figure’s sizing modes, margins (l, r, b, t), height, width, and more. I’ve played with the various Panel row and column configurations, and their respective sizing modes, height, width, and more. I’ve experimented with different variations of these things. I’m all tapped out at this point. Is this a css problem? I have no css experience, but if someone could point me in the right direction I’m eager to learn. Has anyone else experienced something like this before? Please let me know if additional context is needed, thank you very much for any insight!
Edit: Panel visualizations created via pn.pane.Plotly(...) … I’m not sure whether I should be looking to display the Plotly visualizations using another way