The dimensions of the matplotlib plot are determined by the range of the values plotted. How can I specify them separately? With the bokeh backend this would be done with width or height. I had assumed the correct value would be fig_size, but these appears to only take scalar values.
Here’s an example of what’s going wrong:
import holoviews as hv
import numpy as np
import pandas as pd
hv.extension("matplotlib")
df = pd.DataFrame({"x": np.random.randn(100000), "y": np.random.randn(100000)}, index=range(100000))
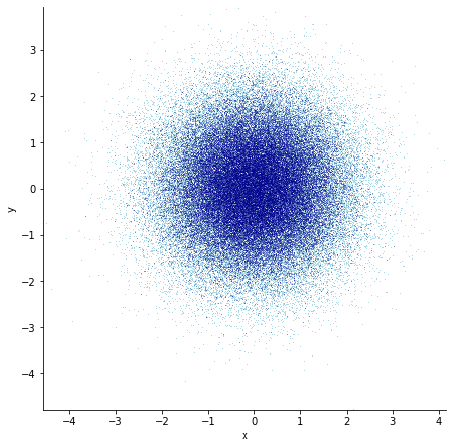
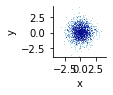
# This looks okay:
display(datashade(hv.Points(df, ["x", "y"])).opts(fig_size=200))
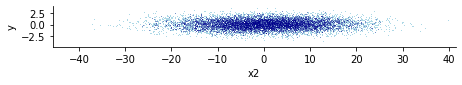
# This does not:
df["x2"] = df["x"] * 10

display(datashade(hv.Points(df, ["x2", "y"])).opts(fig_size=200))
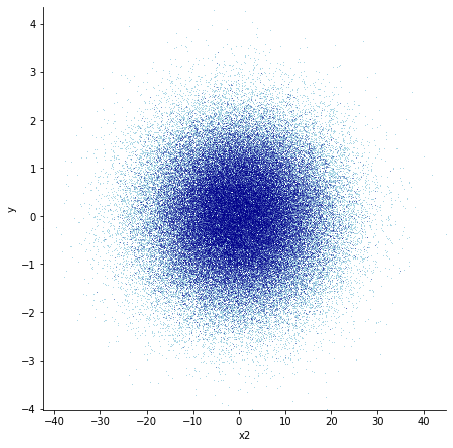
Found my solution! There is an aspect option. While the fig_inches option also sounds like it should work, as of holoviews v1.12.7, it does not.
Here’s an example of usage:
display(datashade(hv.Points(df, ["x2", "y"])).opts(fig_size=200, aspect=1))
Glad you found something that works! That said, I’ll try to see if I can reproduce fig_inches not working…afaik it should…
Here’s an example of the fig_inches behaviour:
import holoviews as hv
import numpy as np
import pandas as pd

hv.extension("matplotlib")

df = pd.DataFrame({"x": np.random.randn(100000), "y": np.random.randn(100000)}, index=range(100000))

display(datashade(hv.Points(df, ["x", "y"])).opts(fig_inches=(1, 3)))
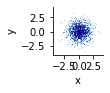
display(datashade(hv.Points(df, ["x", "y"])).opts(fig_inches=(3, 1)))
I think there’s already been an issue opened for this. My preference would just be to unify how plot sizes are set between backends, like what’s discussed here.