Mislabelled categories with @param.depends

Hi,

This is an example that reproduces the problem: categories can´t be updated after I change them once.
Am I supposed to do this in a fundamentally different way?

import panel as pn
import holoviews as hv
import hvplot.pandas  # noqa
import pandas as pd
import param
import numpy as np

class Viewer(param.Parameterized):

    control = param.Number(default=0, bounds=(0,1), step=1)
    
    def __init__(self, **params):
        super().__init__(**params) 
        
        self.traces = []
        for columns in ['ABCD', 'EFGH']:
            self.traces.append(pd.DataFrame(np.random.randint(0,100,size=(100, 4)), columns=list(columns)))
            
        self.panel =  pn.Column(pn.Param(self.param), pn.pane.HoloViews(hv.DynamicMap(self.view)))

    @param.depends("control")
    def view(self):
        return self.traces[self.control].hvplot()

v = Viewer()
v.panel

ezgif.com-gif-maker (1)

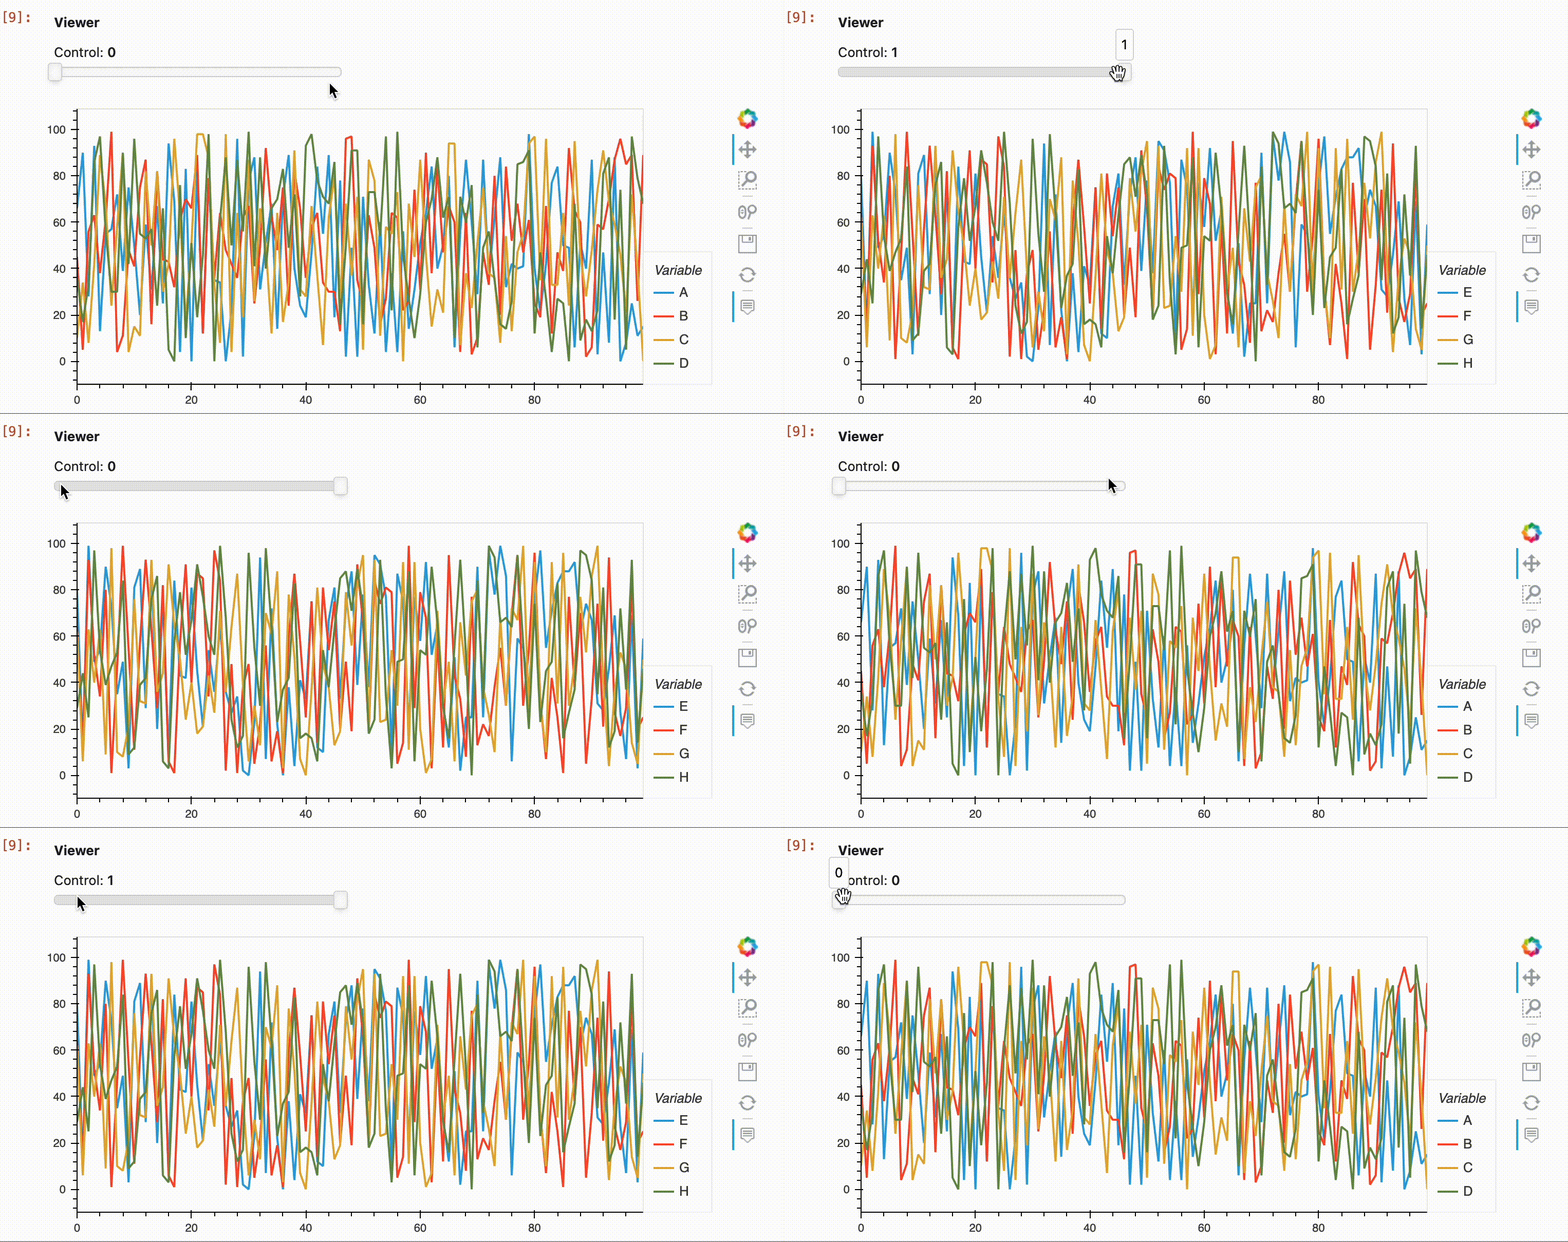
You can notice that once I select Control=1 the categories will not revert back if I select again Control=0. The video starts with the categories A, B, C and D. It get stuck with E, F, G and H even if the actual data is correct! Hope the explanation is clear enough.
Hi @RobertoDF

I think the below gives you what you want based on the usual methods here: Using Param with Panel — Panel v0.14.2

I must admit I was scratching my head a bit at explaining why your method gave the behaviour it did, but I think something strange goes on when you set it to the panel attribute it and call it that way. I don’t think the refreshing is done correctly on the view param method.

import panel as pn
import holoviews as hv
import hvplot.pandas  # noqa
import pandas as pd
import param
import numpy as np

class Viewer(param.Parameterized):

    control = param.Number(default=0, bounds=(0,1), step=1)
    
    def __init__(self, **params):
        super().__init__(**params) 
        
        self.traces = []
        for columns in ['ABCD', 'EFGH']:
            self.traces.append(pd.DataFrame(np.random.randint(0,100,size=(100, 4)), columns=list(columns)))

    @param.depends("control")
    def view(self):
        return self.traces[self.control].hvplot()

v = Viewer()
pn.Column(v.param, v.view)

out

My guess is that the difference is really the use of the DynamicMap. It might be the case (I don’t know) that DynamicMaps assume the dimensions are the same for all plots?