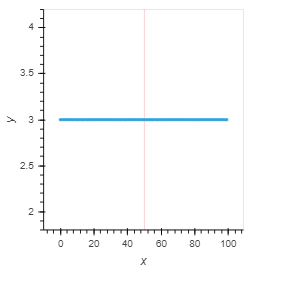
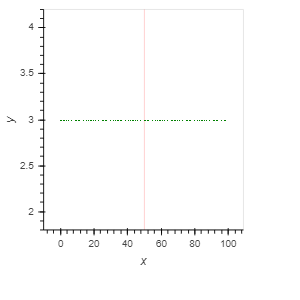
Had problems displaying datashaded ‘flat’ scatter plots, after overlaying with other data, in one go.
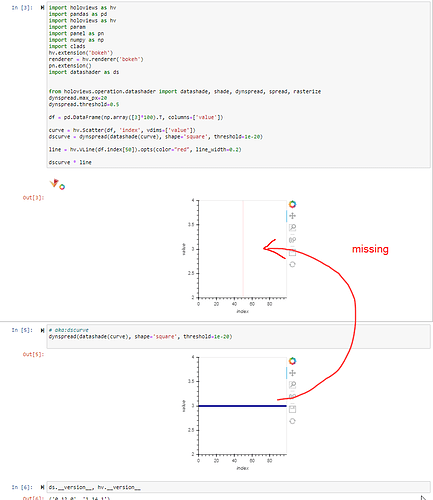
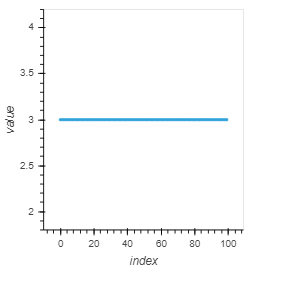
In the below minimum example, if the next cell displays dscurve all cells show the correct data.
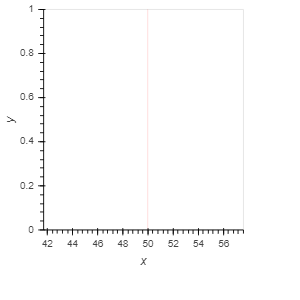
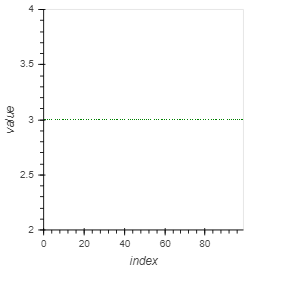
But by itself, dscurve * line , dscurve is ignored in the figure, till the user interacts with the figure controls, or forces another ‘visual’ notebook interaction on dscurve, i.e: displaying it alone in another cell.
Maybe the overlay operation is changing the “interpolation” range of ‘dscurve’ datashading operation? or its getting optimised out somehow? But then why would it appear when the user interacts with the figure…
Puzzled… If you think this is a bug, let me know where to raise the issue, holoviews? datashader?
Any work arounds to programatically force redrawing the “dscurve” without another cell, is also much appreciated…
Kind regards,
Oz
Minimum example below:
import holoviews as hv
import pandas as pd
import holoviews as hv
import param
import panel as pn
import numpy as np
import clads
hv.extension('bokeh')
renderer = hv.renderer('bokeh')
pn.extension()
import datashader as ds


from holoviews.operation.datashader import datashade, shade, dynspread, spread, rasterize
dynspread.max_px=20
dynspread.threshold=0.5

df = pd.DataFrame(np.array([3]*100).T, columns=['value'])

curve = hv.Scatter(df, 'index', vdims=['value'])
dscurve = dynspread(datashade(curve), shape='square', threshold=1e-20)

line = hv.VLine(df.index[50]).opts(color="red", line_width=0.2)

dscurve * line
