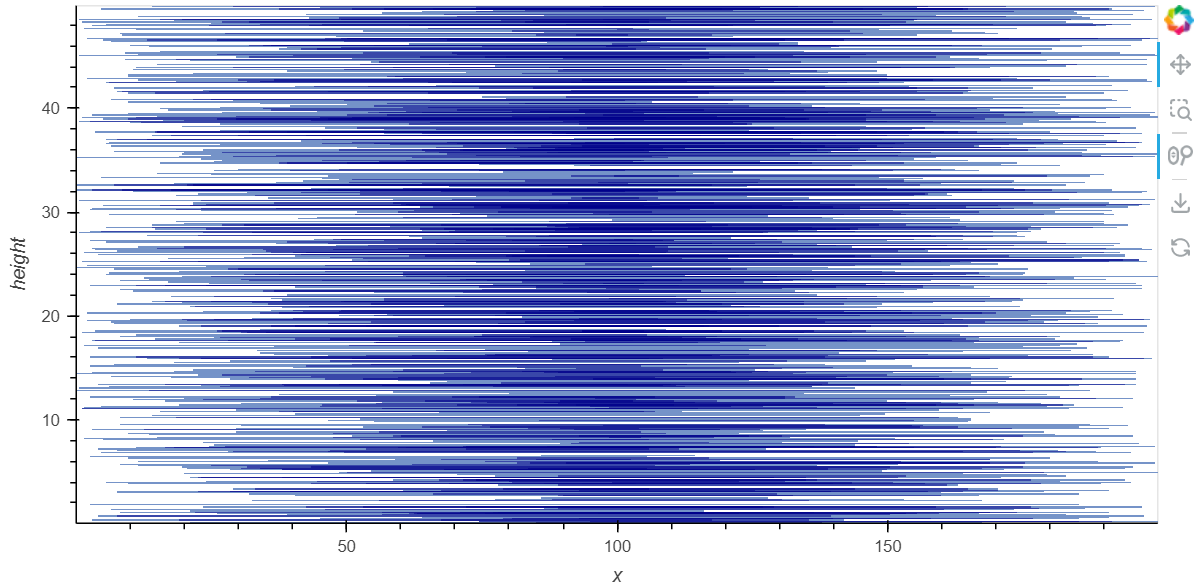
I need to make an interactive HoloViews plot with thousands of horizontal lines defined by a dataframe with left, right and height coordinates. The datasets I’m working with have about 100 000 lines, so I’m also planning to datashade the plot. I can’t figure out a way to plot the lines in a way that doesn’t take a long time to load. Here is what I’ve come up with:
import pandas as pd
import numpy as np
import holoviews as hv
import holoviews.operation.datashader as hd

df = pd.DataFrame({
    'left': np.random.uniform(0, 100, 1000),
    'right': np.random.uniform(101, 200, 1000),
    'height': np.random.uniform(0, 50, 1000),
})

lines_data = [[(row['left'], row['height']), (row['right'], row['height'])] for _, row in df.iterrows()]
lines = hv.Path(lines_data, kdims=["x", "height"])
lines_datashaded = hd.datashade(lines)
lines_datashaded.opts(width=800, height=400)
Is there a way to pass the left, right and height columns as arguments to the hv.Path function instead of coercing them into a list of tuples? Or is there perhaps an alternative function I could use?
