@zeneofa I’m facing the same limitation, and ended up with a few non-perfect workarounds.
- You can use violin rather than boxplot to visualize your data distribution:
pp = hv.Violin(df, kdims=['Feature', 'Strata'], vdims=['Values']).opts(cmap='Category20', box_color='Strata', height=400, width=400, hooks=[changeOrderAndFont])
pp
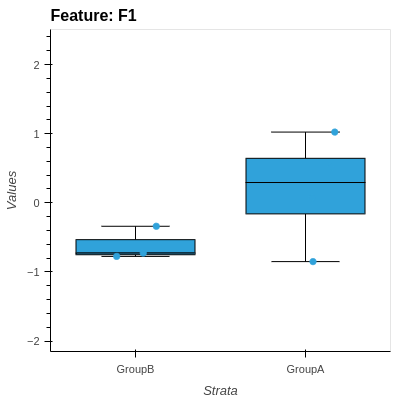
- You may combine boxplot (without the
Stravadimension) and then overlay your boxplot with a scatterplot of your data, each point colored according to itsStratavalue. For instance:
bw = hv.BoxWhisker(df, kdims=['Feature'], vdims=['Values']).opts(cmap='Category20', height=400, width=400)
ss = hv.Scatter(df, kdims=['Feature'], vdims=['Values', 'Strata']).opts(size=6, jitter=0.4, color=dim("Strata"), cmap='Set2')
bw * ss
- You can create a holomap with your preferred dimension of interest. Below, an example with
Featureas key dimension for the Holomap but you can easily do the same withStravaif you prefer:
def workaround_attempt(group):
    bw = hv.BoxWhisker(df[df['Feature'] == group],kdims=['Strata'],vdims=['Values']).opts(cmap='Category20',height=400,width=400)
    ss = hv.Scatter(df[df['Feature'] == group], kdims=['Strata'],vdims='Values').opts(size=6, jitter=0.4, , color=dim('Strata'), cmap='Set1')
    return bw * ss

plot_dict = {group: workaround_attempt(group) for group in df['Feature'].unique()}
hmap = hv.HoloMap(plot_dict, kdims='Feature')
hmap
This will create the individual figures you want, and allow you to switch between them with a widget. You can also display all oplots on a layout using:
hmap.layout().cols(2)
Again, none of these solutions is perfect but I hope it helps you somehow.
For what I know, the problem is related to bokeh rather than holoviews (I tried to find a solution using bokeh but without success so far), but I may be wrong. The best alternative solution I found so far seems to be the RainCloudPlots package but I never tried it and can’t tell if it works for multi-categorical data.
Best,