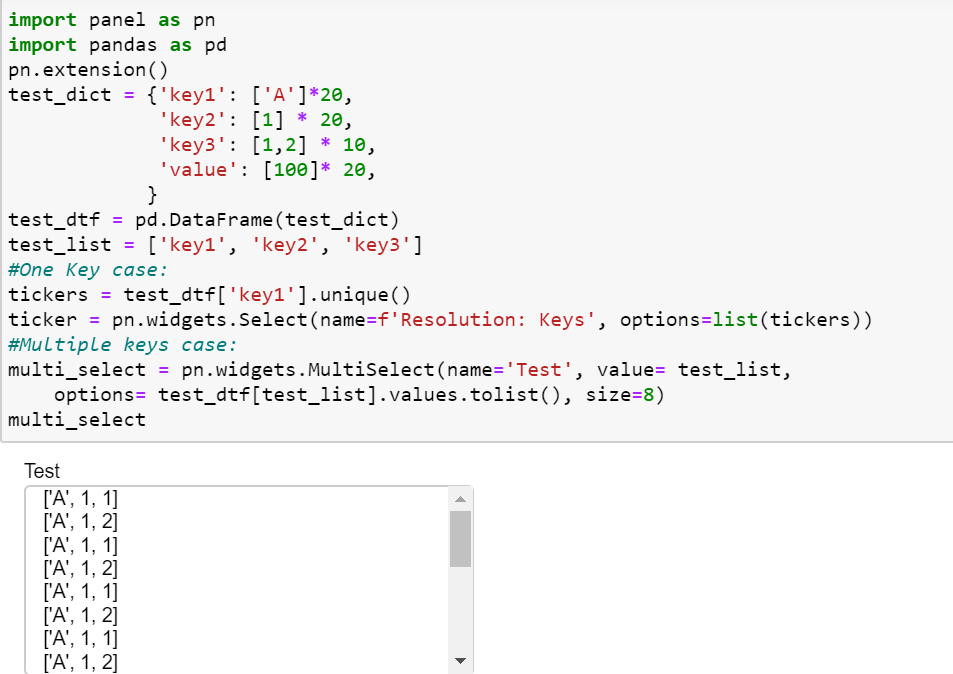
Hello! I would like to use the MultiSelect panel widget with multiple options for each value, and then use the selected option to render a plot, here is a simple test case of what I’m willing to do:
How can I have the same behavior in case of MultiSelect (display only unique values of the keys) and to link the widget to the plot should I use in this case @pn.depends(ticker.param.options) instead of value?
I’m kinda new to Panel and Python, I will appreciate your help, Thank you
For linking the selector with a plot, you can make a param.Parameterized class. In that case you can use a param.ListSelector instead of a pn.widgets.MultiSelect.
Here is an example :
import panel as pn
import pandas as pd
import param
import holoviews as hv
import hvplot.pandas

class AppTest(param.Parameterized):
    test_dict = {"key1" : ['A']*20,
                 "key2" : [1]*20,
                 "key3": [1,2]*10,
                 "value" : [100]*20}

    test_dtf = pd.DataFrame(test_dict)
    test_list = ['key1','key2','key3']
    multi_select = param.ListSelector(objects=test_dtf[test_list].drop_duplicates().values.tolist())

    @param.depends('multi_select')
    def view(self):
        if not self.multi_select:
            return hv.Curve([])
        else:
            df=pd.DataFrame(self.multi_select,columns=['val','x','y'])
            return df.hvplot.scatter('x','y')

pn.extension()
viewer = AppTest()
pn.Row(pn.Param(viewer.param),viewer.view)
@AurelienSciarra Thank you so much! I would like to know what is the difference between param.Parameterized class and the @pn.depends , and if I could use the last one in this cas?
@param.depends is used for linking param objects and functions , but param widgets only works in a param.Parameterized class.
@pn.depends links panel.widgets and function. You can use it inside or outside a param.Parameterized class. In this case you can replace the @param.depends(‘multi_select’) by @param.depends(‘multi_select.value’) and replace the param multi_select by a panel.widgets.
If you want to know if you can do it with pn.depends() and without a param.Parameterized class. I’ll need more detail on what you want to do (what type of function do you want to link). Since I always make a class when I want to create a small app, I don’t really know how to do it this way. Plus in my opinion It’s easier to manage the interaction with param than using panel widgets.
I didn’t understand clearly what you want to do, you said that you consider Company as a key and you want to use multiple key with for each key multiple values. So I was wondering if multi_select is really what you need.
If you have a small number of keys you can use a selector for each key, you will have all the combinations.
In that case you just need to add those new selector to pn.depends and to the signature of the get_plot function.
Another case : If you only need to chose a couple (key, value) you can check this topic
But if you’re good with your MultiSelect, replacing ticker.param.value by multi_select.param.value would do the work. You will need to check if multi_select is empty , if you have selected only 1 value and the case where you have selected several values. Also I have made a mistake with the instantiation of the MultiSelect widget :
multi_select = pn.widgets.MultiSelect(name='Test',
                          value = test_dtf[test_list].drop_duplicates().values.tolist()[0],
                          options = test_dtf[test_list].drop_duplicates().values.tolist())
First of all, I do appreciate your insightful comments, I don’t have a fixed number of keys nor values for each key, so I can’t create a selector for each one.
I would like to do this dynamically using MultiSelect but it doesn’t seem to work for this example when I use " multi_select.param.value", the plot does not show in the output, when I checked I found that the selection was empty! here is an example of my code: https://colab.research.google.com/drive/1I9_bcJTwcOqK1teEJvfslZb-Xv8Zn3M9?usp=sharing
I’m working on this issue to understand the reason why it doesn’t work and I will try the couple ( key, value ) as well, if you have any other suggestions please let me know, and Thank you again.
I can’t use altair on my computer because of javascript error, so I haven’t tested your code yet, but I think you can’t use nested list in transform_filter(). A solution would be to apply your filters on the dataframe instead of applying them on the Chart. Here is an example with hvplot :
import panel as pn
import pandas as pd
import datetime as dt
from vega_datasets import data
import numpy as np
import hvplot.pandas


dtf = data.stocks()
dtf=pd.DataFrame(dtf)
dtf['key2']=[1]*560
dtf['key3']=[2]*560
title='title'
subtitle='subtitle'

test_list = ['symbol','key2','key3']
multi_select = pn.widgets.MultiSelect(name='Test',value = dtf[test_list].drop_duplicates().values.tolist()[0],
                                     options = dtf[test_list].drop_duplicates().values.tolist())

date_range_slider = pn.widgets.DateRangeSlider(name='Date Range slider',start=dt.datetime(2001,1,1), end=dt.datetime(2010,1,1),
                                                value=(dt.datetime(2001,1,1),dt.datetime(2010,1,1)))

@pn.depends(multi_select.param.value,date_range_slider.param.value)
def get_plot(multi_select,date_range):
    df = dtf
    df['date'] = pd.to_datetime(df['date'])

    start_date = date_range_slider.value[0]
    end_date = date_range_slider.value[1]
    mask = (df['date'] > start_date) & (df['date'] <= end_date)
    df = df.loc[mask]

    if len(multi_select)==0:
        _multi_select=[]
    elif isinstance(multi_select[0],str):
        _multi_select=[multi_select]
    else:
        _multi_select=multi_select

    ms=list(map(lambda x : ','.join(np.array(x).astype(str)),_multi_select))
    df=df[df[test_list].apply(lambda x : ",".join(x.astype(str).values) in ms,axis=1)]
    return df.hvplot.area('date','price').opts(color='#0c1944',alpha=0.8)


dashboard = pn.Row(pn.Column(title,subtitle,multi_select,date_range_slider),get_plot)

dashboard
Thank you @AurelienSciarra, I discovered with you another amazing library hvplot!
You’re right transform_filter can’t be used for nested list, I tested the example you gave me, and it works fine with multiple keys, however it doesn’t when working with one or multiple keys (!= str), so I changed the condition to include this use case as well but the output hvplot is empty:
import panel as on
import pandas as pd
import datetime as dt
from vega_datasets import data
import numpy as np
import hvplot.pandas


dtf = data.stocks()
dtf=pd.DataFrame(dtf)
dtf['key2']=[1]*560
#dtf['key3']=[2]*560
title='title'
subtitle='subtitle'

#test_list = ['symbol','key2','key3']
test_list = ['key2']
multi_select = pn.widgets.MultiSelect(name='Test',value =
dtf[test_list].drop_duplicates().values.tolist()[0],
                                 options = dtf[test_list].drop_duplicates().values.tolist())

date_range_slider = pn.widgets.DateRangeSlider(name='Date Range
slider',start=dt.datetime(2001,1,1), end=dt.datetime(2010,1,1),
                                            value=(dt.datetime(2001,1,1),dt.datetime(2010,1,1)))

@pn.depends(multi_select.param.value,date_range_slider.param.value)
def get_plot(multi_select,date_range):
print(len(multi_select))
df = dtf
df['date'] = pd.to_datetime(df['date'])

start_date = date_range_slider.value[0]
end_date = date_range_slider.value[1]
mask = (df['date'] > start_date) & (df['date'] <= end_date)
df = df.loc[mask]

if len(multi_select)==0:
    _multi_select=[]
elif len(multi_select)==1:
    _multi_select=[multi_select]
else:
    _multi_select= multi_select

ms=list(map(lambda x : ','.join(np.array(x).astype(str)),_multi_select))
df=df[df[test_list].apply(lambda x : ",".join(x.astype(str).values) in ms,axis=1)]
return df.hvplot.area('date','price').opts(color='#0c1944',alpha=0.8)


dashboard = pn.Row(pn.Column(title,subtitle,multi_select,date_range_slider),get_plot)

dashboard
In your example multi_select = [[1]] which verify len(multi_select)==1 but that means _multi_select = [[[1]]].
That will cause an error when we compute ms.
You need to change the condition by :
if len(multi_select)==0:
        _multi_select=[]
elif len(np.shape(multi_select))<=1:
        _multi_select=[multi_select]
else:
        _multi_select=multi_select