Hi Community,
Is there a way to mute/hide a data series visualization in a Layout overlay by default?
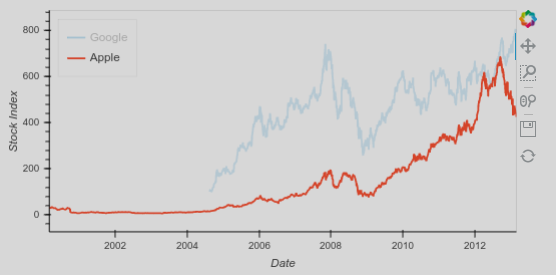
For example, I want visualize two time series, where one of them should be by default muted/hidden.
What options do I use to achieve this?
import numpy as np
import holoviews as hv
from bokeh.sampledata.stocks import GOOG, AAPL

goog_dates = np.array(GOOG['date'], dtype=np.datetime64)
aapl_dates = np.array(AAPL['date'], dtype=np.datetime64)

goog = hv.Curve((goog_dates, GOOG['adj_close']), 'Date', 'Stock Index', label='Google').opts(muted=True)
aapl = hv.Curve((aapl_dates, AAPL['adj_close']), 'Date', 'Stock Index', label='Apple')

fig = (goog * aapl).opts(width=600, legend_position='top_left')
fig
More generally,
Is there a full list of options for these holoviews objects I can look up?
How to I print a full list of options used by a particular holoviews object?
I haven’t found the option to mute series by default but I’ll reply to myself regarding the two general questions:
Is there a full list of options for these holoviews objects I can look up?
One could use tab completion to discover available options in an interactive environment.Curve one could press tab inside the brackets in opts.Curve():
from holoviews import opts
opts.Curve([tab])
Another options is to consult the help page on specific elements, e.g., hv.help(hv.Curve)
See introduction: Customization — HoloViews v1.18.1 https://holoviews.org/user_guide/Applying_Customizations.html#Discovering-options
How to I print a full list of options used by a particular holoviews object?
For a Holoviews Element the options info can be retrieved by .opts.info()
1 Like
Marc
March 3, 2021, 4:54pm
3
Hi @Pill-GZ .
I don’t know how to solve this. But have you looked at https://github.com/holoviz/holoviews/issues/3730 ?
1 Like
Hi @Marc ,
This (i.e., overlaid plots do not respect “muted” option) looks like a bug.https://github.com/holoviz/holoviews/issues/4784
(I have not tried the latest commit.)
1 Like