I have a chart with multiple series (3 lines + 7 scatter). At initial load I want all the scatter plots except #1 to be muted. For the line charts “muted” option works, but not for scatter.
1 Like
Can you share a minimal, reproducible example (MRE)?
In general, a complete script that can be copied/pasted and immediately run, as-is, with no modifications.
1 Like
import numpy as np
import pandas as pd
import panel as pn
import hvplot.pandas

data = np.random.randint(5, 30, size=(10, 3))

df = pd.DataFrame(
    data, columns=['random_numbers_1', 'random_numbers_2', 'random_numbers_3'])

df.index.name = 'idx'

line = df.hvplot.line(
    x='idx', y='random_numbers_1', label='random_numbers_1',
    min_width=1000, min_height=600).opts(tools=['hover'])

scat1 = df.hvplot.scatter(
    x='idx', y='random_numbers_2', label='random_numbers_2',
    min_width=1000, min_height=600).opts(tools=['hover'])

scat2 = df.hvplot.scatter(
    x='idx', y='random_numbers_3', label='random_numbers_3',
    min_width=1000, min_height=600).opts(tools=['hover'])

bootstrap = pn.template.BootstrapTemplate(
    title='Dashboard #1')

layout = pn.Column(line * scat1 * scat2)

bootstrap.main.append(layout)

bootstrap.servable()
Execute using the following command
panel serve .\x02-panel-sample.py --show --dev
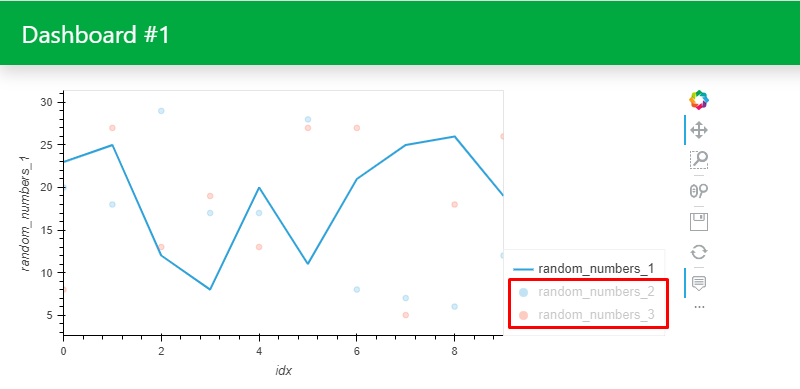
Looking for the following at the initial load where the 2 scatter plots are muted
1 Like
Adding a hook to the scatter plot will make them muted. For the line plot it is exactly possible to use .opts(muted=True) and get the same effect. This was added in here, but is not available for the scatter plot. I have open an issue on GH here.
import numpy as np
import pandas as pd
import panel as pn
import hvplot.pandas

pn.extension()

data = np.random.randint(5, 30, size=(10, 3))

df = pd.DataFrame(
    data, columns=["random_numbers_1", "random_numbers_2", "random_numbers_3"]
)

df.index.name = "idx"


def mute_hook(plot, element):
    plot.handles["glyph_renderer"].muted = True


line = df.hvplot.line(
    x="idx",
    y="random_numbers_1",
    label="random_numbers_1",
    min_width=1000,
    min_height=600,
).opts(tools=["hover"])

scat1 = df.hvplot.scatter(
    x="idx",
    y="random_numbers_2",
    label="random_numbers_2",
    min_width=1000,
    min_height=600,
).opts(tools=["hover"], hooks=[mute_hook])

scat2 = df.hvplot.scatter(
    x="idx",
    y="random_numbers_3",
    label="random_numbers_3",
    min_width=1000,
    min_height=600,
).opts(tools=["hover"], hooks=[mute_hook])


line * scat1 * scat2
1 Like