Hello, we are building a web site with scientific web tools. This includes also showing charts. The backed is on Python Django. I do not understand and fail to find answers/examples on how to form an interactive (pan, zoom, etc) chart and render it in my Django template. Its always some kind of ipynb (juniper demos) thing or something like https://github.com/bokeh/bokeh/tree/master/examples/app/gapminder this where one have no idea whats is reading the template and how this tied up. Can somebody help me out here?
Django is a bit tricky if you have no experience with HoloViews & Panel.
So, before you do that, read the docs & look at the examples and try to get your plots to work in Jupyter. You can then wrap them with Panel and see if you can serve your results in the browser.
If you’ve done that and everything works, check out the examples section on Panel’s Github. It includes examples on how to serve an app in Django.
1 Like
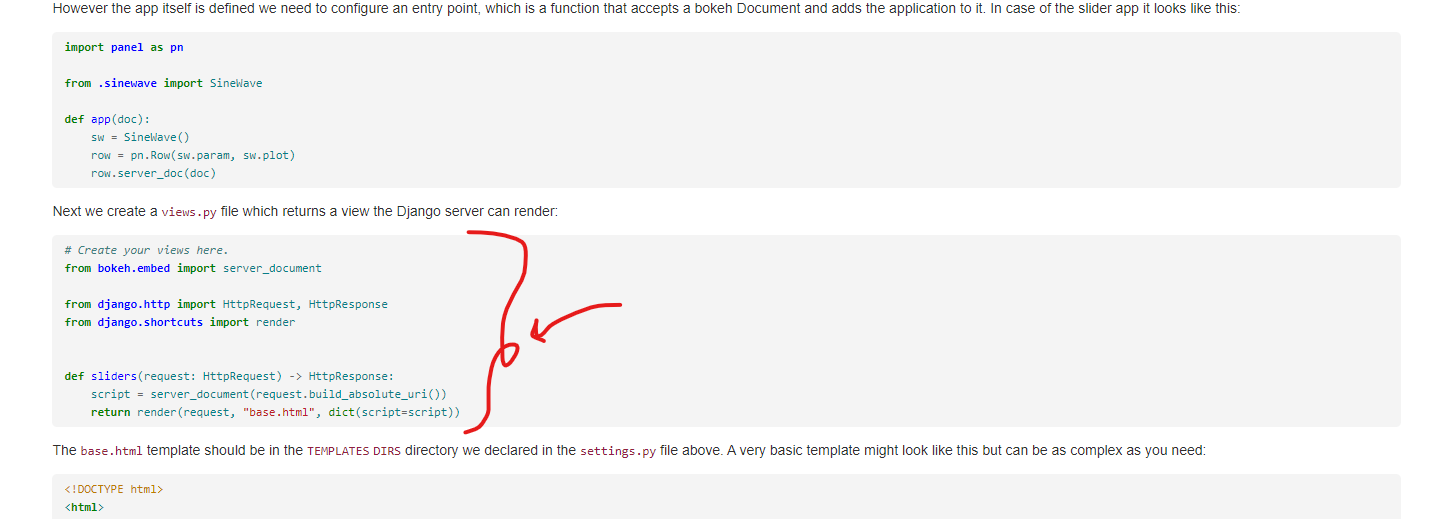
I’m looking at https://github.com/holoviz/panel/tree/master/examples/apps/django2/sliders and I just don’t get it. How does SineWave makes it’s way to the view and final render  .
.
1 Like
Hi @trsh
Have you read and tried following at https://panel.holoviz.org/user_guide/Django_Apps.html?
This should guide you through setting up Django and Panel together. If possible please try that out.
I hope that will help. If not please ask more questions.
You are starting at the difficult end. Learning how to get everything working together instead of taking one small learning step at a time (I do the same :-)).
On the question of how SineWawe makes it’s way to the view I believe this is the answer.
1 Like
Ehh not really. But I try your suggestion