First up some perspective from a new user… I dont mean for this to be overly critical, i appreciate the complexity of the challenge, i just mean to remind the old pro’s of the perspective of a new user.
I’m looking for a way to do a browser based user interface for a python app with interactive plots, tables, etc. I started off with Dash, but abandoned it since the stateless-ness became such a hassle for something i intend to host locally for a single user. Panel seems like a great alternative with much of the same functionality but a much more intuitive callback/functional structure.
Now, i’ve spent a few days trying to move to Panel and i find it extremely confusing. There’s so much magic in this library that i’m struggling to figure out how to do anything even slightly different from the examples. I’m sure i’m not the target use case, but for me it missed the balance between making the easy case easy and making the slightly different case understandable.
As for some specific comments.
Holy cow is it hard to search google for help on ‘panel’. google has no idea that i mean the proper name Panel. Couldnt it have been panelx or something unique? i can use ‘holoviz panel’ but plenty of help info out there doesnt reference holoviz. (same goes for dash tho google seems to associate it with plotly better than panel with holoviz).
Getting the layout to look the way i want is much more difficult than with Dash, i actually like its style for the layout. Again that’s my preference for control vs magic. It sounds like some improvements are coming in version 1.
Early on i struggled to figure out how to initialize empty components( and im still a bit unclear on the differences between panes and panels and params and widgets). My ui starts nearly empty and populates as the user makes selections and open files, etc. I eventually found the following example which helped a lot, it might be worth some mention in the user guide since it is quite simple.
https://panel.holoviz.org/gallery/dynamic/dynamic_plot_layout.html
However, i still don’t really want placeholders (i usually make the component invisible to start), so i get the following warning often. Is there a more elegant way to avoid the warning without using a placeholder that will be hidden?
WARNING:bokeh.core.validation.check:W-1002 (EMPTY_LAYOUT): Layout has no children: Row(id='1013', ...)
Param (the proper name) is also very confusing, it feels like its fighting python. How can i define a param (proper name) as a class attribute, then pass the class a kwarg with the same key at instantiation, and then have it behave as an instance variable? I agree those behaviors are handy, but they’re very confusing since that’s not how python works normally. Oh, and it is magically a widget? I’m sure that much of my misunderstanding of Panel stems from misunderstanding Param. Also, it makes the documentation quite confusing to tell whats a proper param and whats a parameter.
Now if anyone has stuck around this long, i have some real questions.
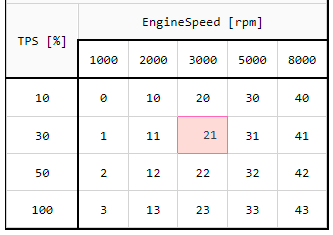
First, i want a widget for editing table data, but my table data is not in a pandas dataframe and it is often 2d. I would like to have an active cell, keyboard navigation, and for the cell values to be editable. Heres a simple example of what i’d like it to look like.
I spent some time looking into tabulator but couldnt see a good path to get what im looking for (surely there is, it seems quite powerful but i couldnt see it at first glance). So i headed down the path of a reactiveHTML component to build a simple table. Again, this seems like it can be very powerful but im stuck at not understanding the magic thats happening in the background.
Is there a way to use a param of a custom class? I have custom classes for working with my table data that contain all the info you might want in a plot, so it would be most handy to pass that to this reactiveHTML. I tried using param.ClassSelector but then i wasnt able to access the attributes in the class from the template. I guess would also need to be able to work with the data in a function to make this really useful, i suppose i could do an def __init__(self,**kwargs): but clearly thats not intended.
So, i broke the params up.
class CalData1d(pn.reactive.ReactiveHTML):
    """Class for custom table data control."""

    name = param.String(doc="Param Name.")
    axis1_name = param.String(doc="Axis1 Name.")
    axis1 = param.Array(doc="Axis1 Breakpoints.")
    data = param.Array(doc="Param Data.")

    _child_config = {
        "name": "literal",
        # "axis1_name": "literal",
        # "axis1": "literal",
        # "data": "literal",
    }

    _template = """
    <table id="cal-data" class="cal-data" style="border:1px solid;border-radius:8px;">
        <tbody>
        <tr id="cal-data-row-0">
            <th id="cal-data-0-0" class="cal-data-name" colspan="${axis1.size}">${pardata.name}</th>
        </tr>
        <tr id="cal-data-row-1">
            <th id="cal-data-1-0" class="cal-data-axis1name" colspan="${axis1.size}"">${axis1_name}</th>
        </tr>
        <tr id="cal-data-row-2">
            {% for val in axis1 %}
            <th id="cal-data-2-{{loop.index0}}" class="cal-data-axis1" >{{val}}</th>
            {% endfor %}
        </tr>
        <tr id="cal-data-row-3">
            {% for val in data %}
            <th id="cal-data-3-{{loop.index0}}" class="cal-data-data" >{{val}}</th>
            {% endfor %}
        </tr>
        </tbody>
    </table>
    """
But, now im running into ValueError's when instantiating this reactiveHTML class in a callback. for the simplified example below i am getting the following error ValueError: String parameter 'axis1_name' only takes a string value, not value of type <class 'panel.pane.markup.Markdown'>.
Its very confusing that it magics my string into a pane but only if its a child.
So if i modify this code to mark all of the params as literal (which is confusing, these aren’t literals, but i think i get what this means) then i get the following error: AttributeError: 'numpy.ndarray' object has no attribute 'on_change'.
This line in the User Guide seems like a clue, but i really need another clue or two to put it together.
“The difference between Jinja2 literal templating and the JS templating syntax is important to note. While literal values are inserted during the initial rendering step they are not dynamically linked.”
So, what does literal templating mean? I presume that simply means passing the value of the param into the template, not a magic pane.
Is that still different from marking the param as literal in the _child_config?
What does dynamically linked mean precisely? Is that linking callbacks? And if so which?
Also, im using the jinja syntax here which sounds like it is not linked, so what is looking for an on_change attribute (which sounds like a link) in the np.ndarray?
Anyway, sorry for the whinging. I’m clearly trying to do something that this wasnt intended for, and i dont understand it well enough to accomplish that. I can see it has a lot of potential and is very powerful, but as a new user all the magic makes it very hard to move from the example cases to something more specialized. I would appreciate some tips either of specifics, or of more general suggestions on a better approach, or pointers to more documentation and help.
Thanks for the help.